
MZ ratios
M/Z ratios: Mass hysteria ensues
Before we run our samples on the mass spectrometer, we need to know what mass-to-charge ratios (m/z ratios) to use. By looking at the output m/z ratios of previous runs, we can assess which range to use. To do this, I examined Rhonda’s larval Crassostrea gigas mass spectrometer results.
Previous runs were generally saved on Emma’s database, which allows the user to search mass spectrometer output using a handy web interface. However, Rhonda’s data is saved on our lab computer Emu. This made the process of extracting and manipulating the files I needed convoluted. With some lab teamwork, we figured it out!
Here’s the final protocol:
- Using this R script, I randomly selected 10 of Rhonda’s samples to work with. The files I need to work with are the ones named
interact..pep.xml - I used the following code to manipulate the
pep.xmlfile of interest. The code manipulates TPP viewer through the command line and allows me to export the data file as an.xlsdocument.
/usr/tpp_install/tpp/cgi-bin/PepXMLViewer.cgi -C Pprobability,Gspectrum,Sexpect,Gions,Gpeptide,GMZratio,Gcalc_neutral_pep_mass,Gprotein -B exportSpreadsheet 1 -I /path/to/pep.xml/file
- I then used the following code to copy the files from Emu to my local machine
scp srlab@128.95.149.195:~/Documents/rhonda/path/to/pep.xls/file /Users/yaaminivenkataraman/Desktop
- In the R script I merged all the
.xlsfiles and created a histogram depicting the frequency of m/z ratios in the samples.
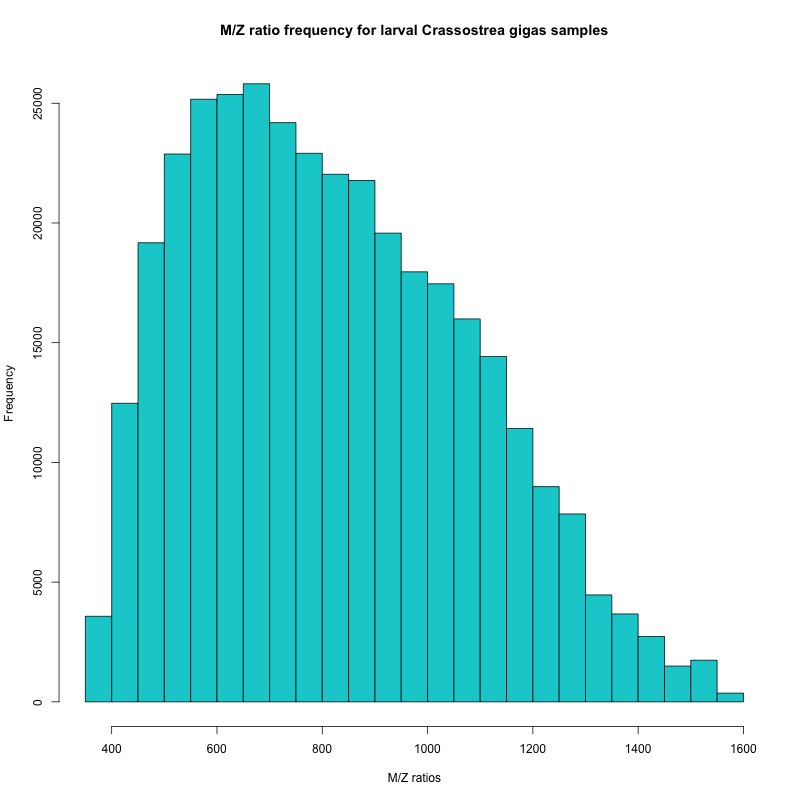
Figure 1. Frequency of m/z ratios from Rhonda’s samples
In the histogram, I can see that the majority of my peptides have m/z ratios between 450 and 950. Based on this information, Emma will set the range for my mass spectrometer runs.