
DML Analysis Part 21
Examining sample clustering
Something Shelly brought up at the end of last quarter is how odd my sample clustering is. Previously, I compared dendograms and PCA plots for my samples using different mincov settings for methylKit. Of the settings I used, mincov = 3 produced the best clustering and PCA output:
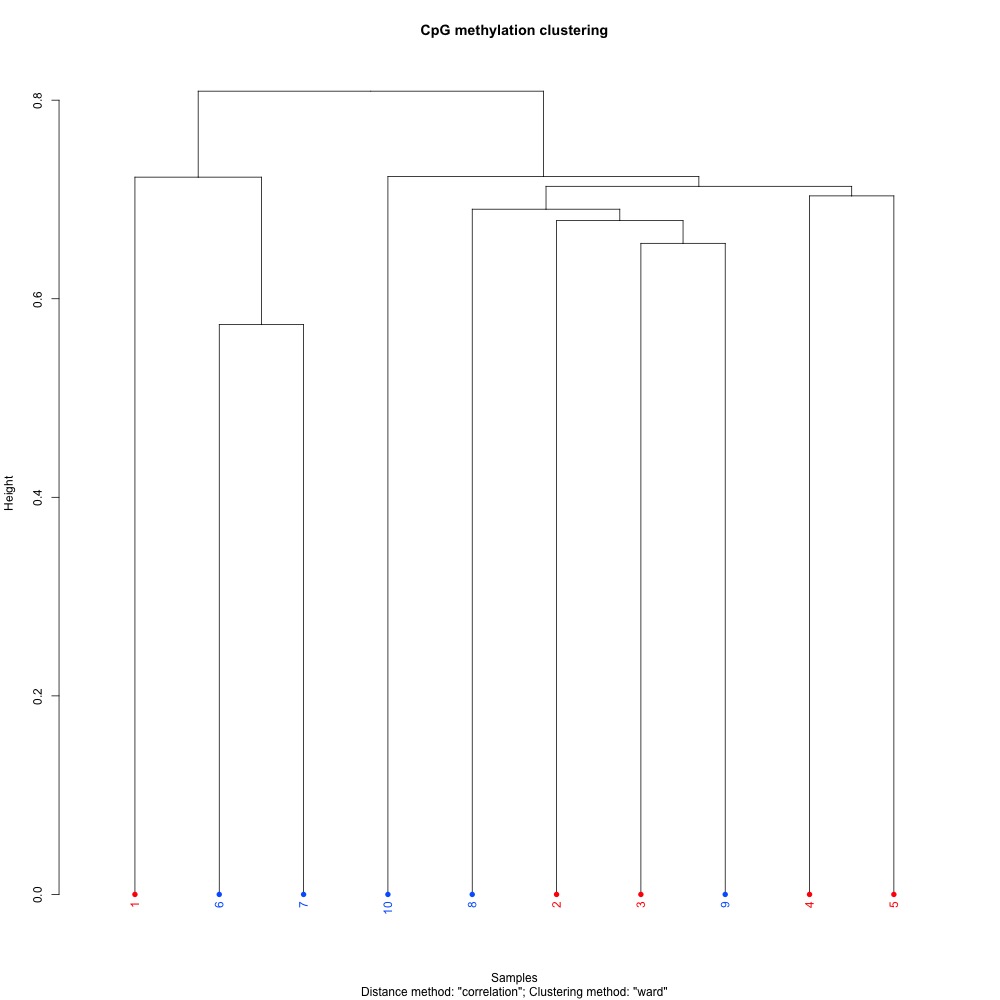
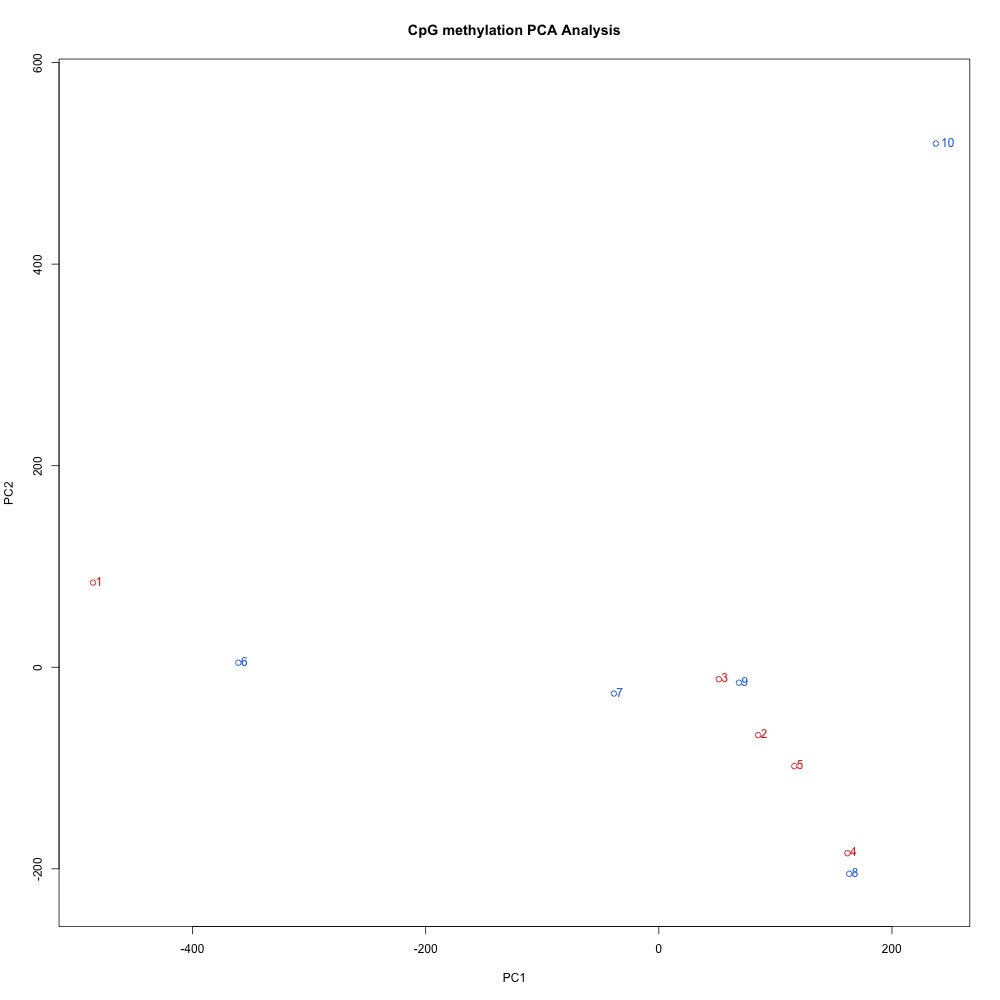
Figures 1-2. Dendogram and PCA plots for C. virginica gonad sequence data using mincov = 3.
She suggested I revist these plots to see if I could improve clustering by changing my alignment stringency in bismark. HJ mentioned looking at SNP data may also help explain my poor clustering. Looking at these plots again, I see that O1 is farther from the other treatment samples in the PCA, and very separated in the dendogram. This sample also had the lowest mapping efficiency. I decided to see what happened to clustering if I removed that sample before looking into different alignments or SNPs.
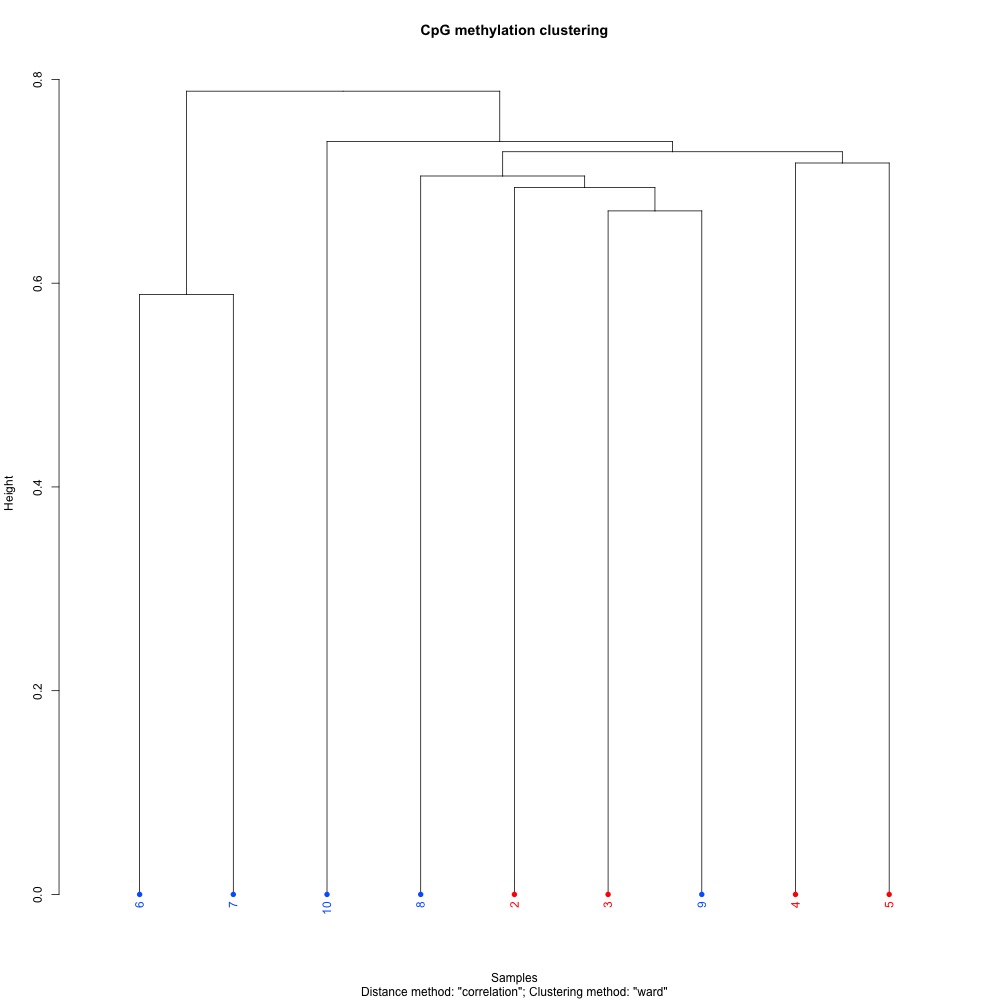
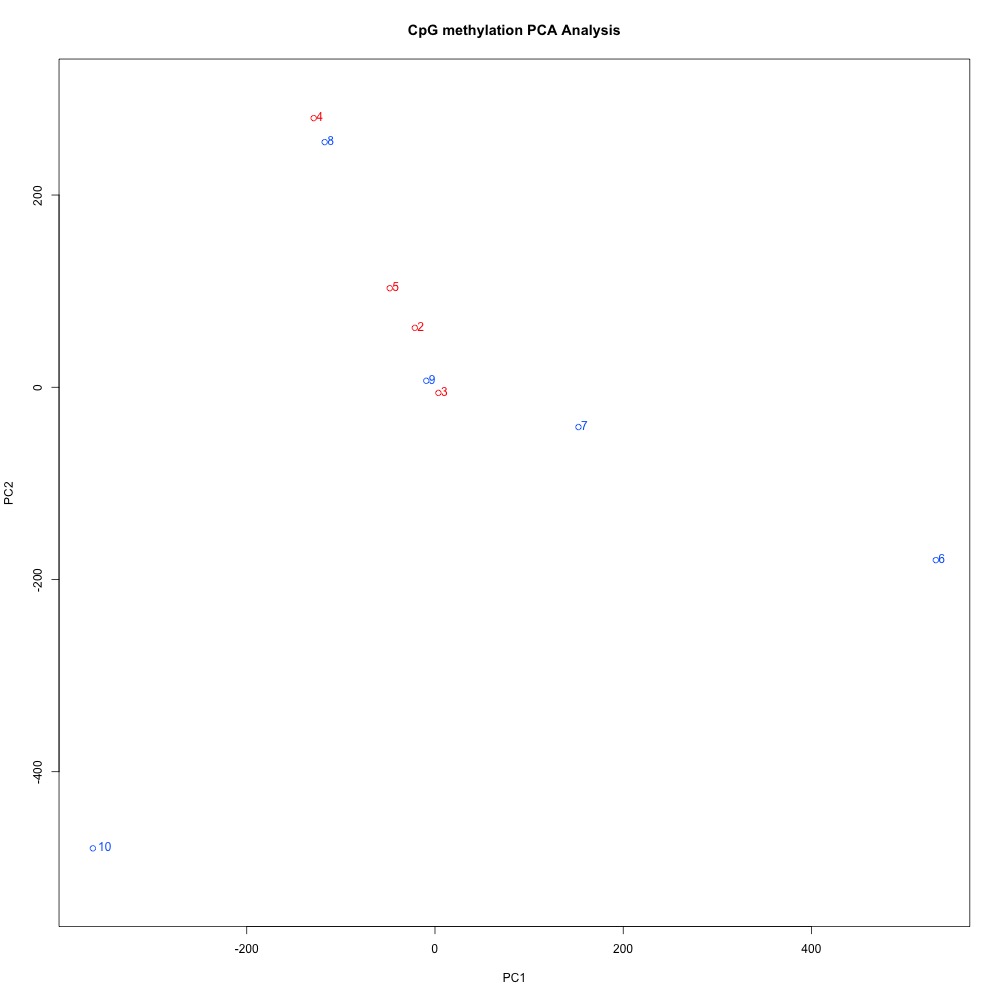
Figures 3-4. Dendogram and PCA plots for sequence data, omitting sample 1.
Without sample 1, the clustering in the PCA looked a bit better. The red samples are from the control treatment, while the blue samples are the high pCO2 treatment. It could be that there’s no coordinated methylation response to ocean acidification, or that alignment stringency or SNPs are affecting clustering. I have to do some more digging.
Going forward
- See how alignment stringency or SNPs affect clustering
- Determine if a formal gene enrichment is necessary
- If necessary, select the most appropriate gene enrichment method
- Describe functions of most interesting genes with DML and DMR