
Remaining Analyses Part 9
My final NMDS
The first way I thought I could tie together environmental data with protein expression was an NMDS plot with eigenvectors based on environmental variables. I realized that wasn’t possible only after I made my NMDS by region in this script.
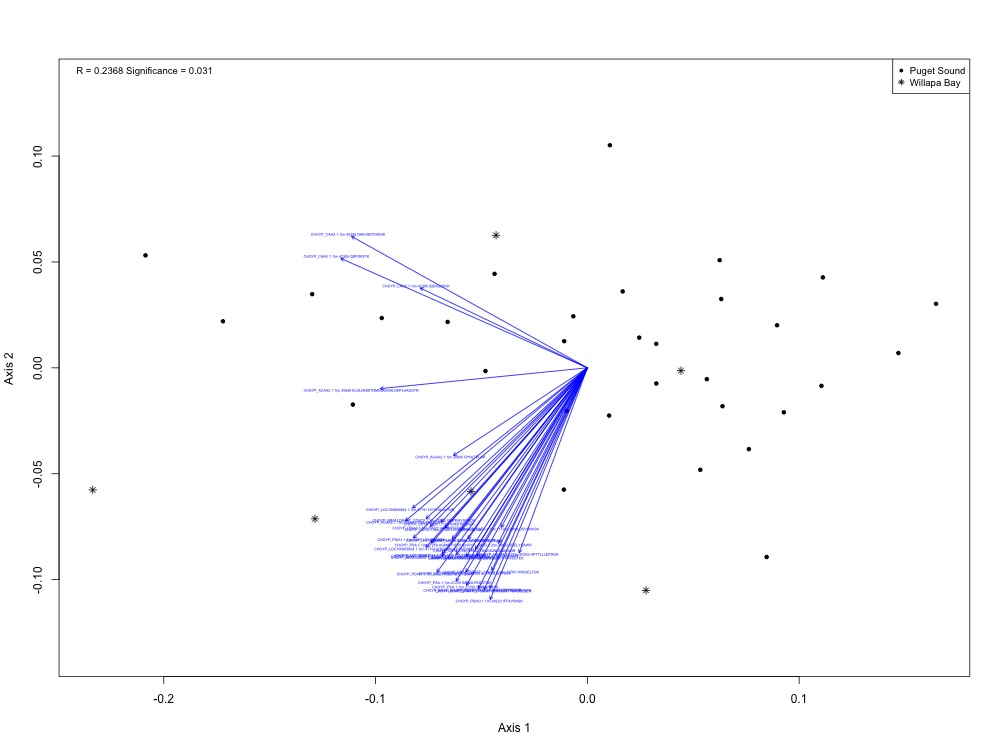
Figure 1. NMDS for protein expression by region (Puget Sound vs. Willapa Bay).
I actually ended up with a significant ANOSIM result when splitting up the regions! I got R = 0.2368 instead of an expected R of -0.002, with a p-value of 0.31.
Since the eigenvector thing isn’t going to work out, here’s my game plan to create figures with protein expression, environmental variable and biomarker data:
- Clip out low tide/exposure recordings from salinity, pH, and dissolved oxygen data
- Visualize diurnal fluctuations
- Salinity
- pH
- DO
- Boxplots
- Salinity
- pH
- DO
- Calculate maximum, minimum, mean, and median for variables that show differences in Willapa Bay. So far, these are temperature, delN, and tissue mass
- Remake boxplots for significantly different peptides with secondary y-axes for variables found to be significant in the previous step
- Add lines denoting calculated maximum, minimum, etc. on top of boxplots for protein expression
Written on November 28, 2017