
CEABiGR Part 8
Alternative splicing analyses
One thing we want to determine with this dataset is how methylation may regulate gene expression. Since we have no differentially expressed genes, we cannot match DMG with DEG. Plus, most marine invertebrate literature doesn’t show a 1:1 relationship with DMG and DEG anyways. I decided to use two separate methods to characterize differences in gene expression: predominant isoform analysis and transcriptional noise analysis.
XY plots
But first…xy plots. I imported gene methylation and gene expression data into this R Markdown script. I then recreated the standard methylation-expression plot, with percent methylation on the x-axis and log expression on the y-axis:
femMethExp %>%
ggplot(.) + geom_point(aes(x = meth, y = log_exp), colour = "#006D2C") +
  labs(x = "Methylation (%)", y = "log FPKM") +
  geom_smooth(aes(x = meth, y = log_exp), method = lm, colour = "grey20", size = 2, na.rm = TRUE) +
  theme_minimal()
ggsave("../output/42-predominant-isoform/fem-meth-exp-xy.pdf", height = 8.5, width = 11)
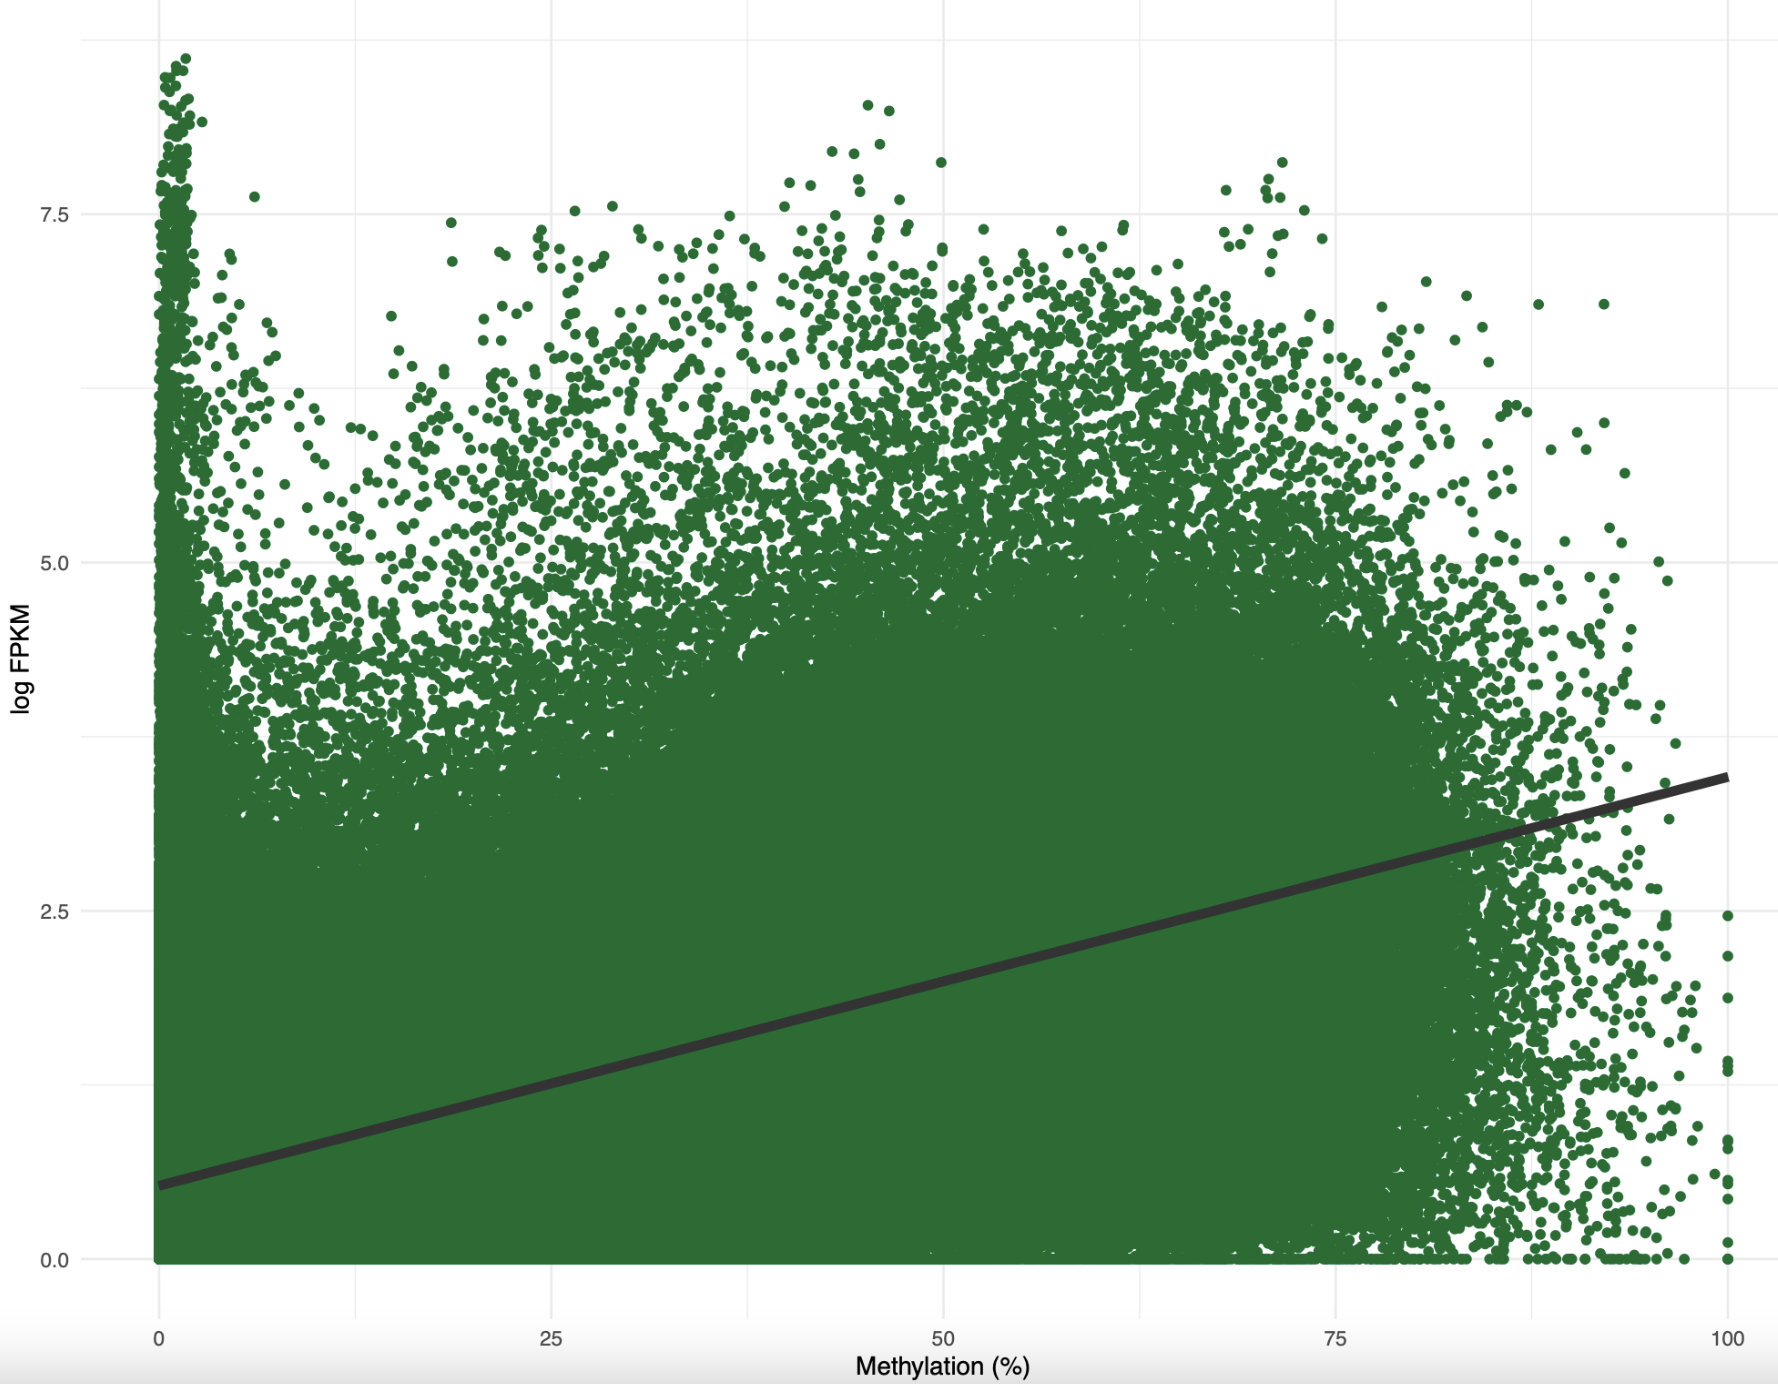
Figure 1. Percent methylation by log FPKM for female samples
When I added a best-fit linear model, the correlation was around 0.5. I need to find a better way to plot this taking into account density of data. I also made a similar plot for methylation and CV:
femMethExpCV %>%
ggplot(.) + geom_point(aes(x = meth, y = CoV_FPKM), colour = "#006D2C") +
  labs(x = "Methylation (%)", y = "CV") +
  scale_y_continuous(limits = c(0,3)) +
  geom_smooth(aes(x = meth, y = CoV_FPKM), method = lm, colour = "grey20", size = 2, na.rm = TRUE) +
  theme_minimal()
ggsave("../output/42-predominant-isoform/fem-meth-CV-xy.pdf", height = 8.5, width = 11)
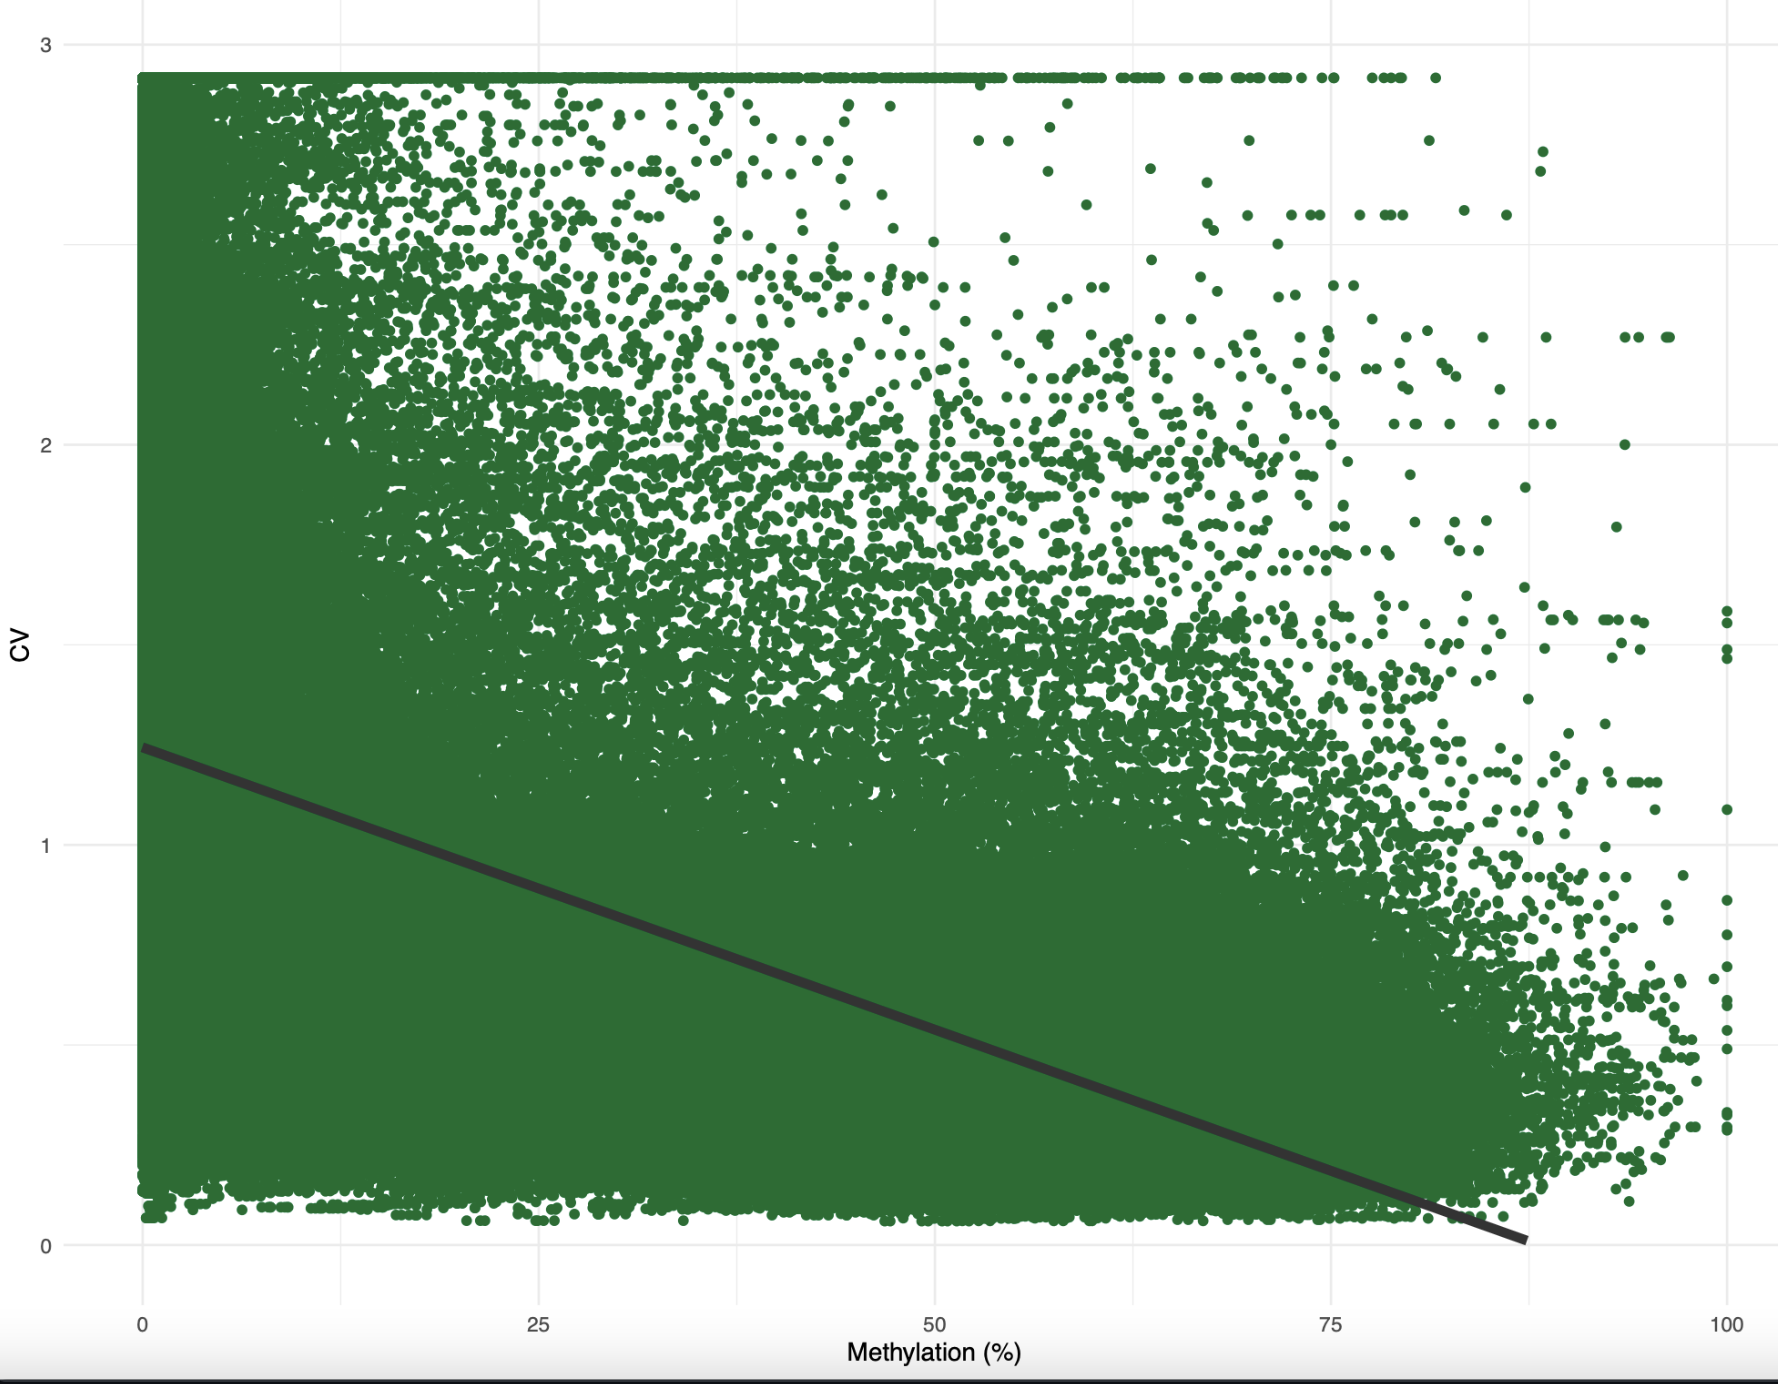
Figure 2. Percent methylation by CV of expression for female samples.
Okay, this one was weirder. I don’t know why CV was so low overall. Additionally, I probably need to tweak this a bit before plotting since there’s one CV value per treatment per gene, whereas there’s one methylation value per sample per gene. However, you still see the negative correlation expected, where increased methylation reduces CV of expression.
Predominant isoform analysis
Based on discussions with Sam and Steven, Sam created a [table with binary information that describes if the predominant isoform of a gene changed under OA conditions]((https://github.com/sr320/ceabigr/blob/main/output/42-predominant-isoform/predom_iso-diff-controls_vs_exposed-female.tab) in this Jupyter notebook. I imported that file into this R Markdown script and separated male and female data. I also imported the [total number of transcripts per gene]((https://github.com/sr320/ceabigr/blob/main/output/34-transcript-counts/transcripts-counts-max_per_gene.tab).
I filtered the predominant isoform data to only include 1) genes with multiple isoforms and 2) genes where expression > 0. Out of 10,559 genes, 2,198 (~20%) had a shift in predominant isoform due to low pH. I used a two-sided 1-sample z-test to determine that the shift in predominant isoform happened significantly less than what would be expected by chance. Since I had a list of predominant isoforms, I wanted to see if there was any difference in function for these genes. When I annotated the list of genes with and without a predominant isoform shift, I found that they had the same main gene functions (development, cell organization and biogenesis). Alright, so there was no functional difference between genes with and without a predominant isoform shift. What about any difference in methylation? When I created an XY plot for methylation and expression of genes with a predominant isoform shift, it looked very similar to the plot with all genes! In fact the equations and correlations were almost identical.
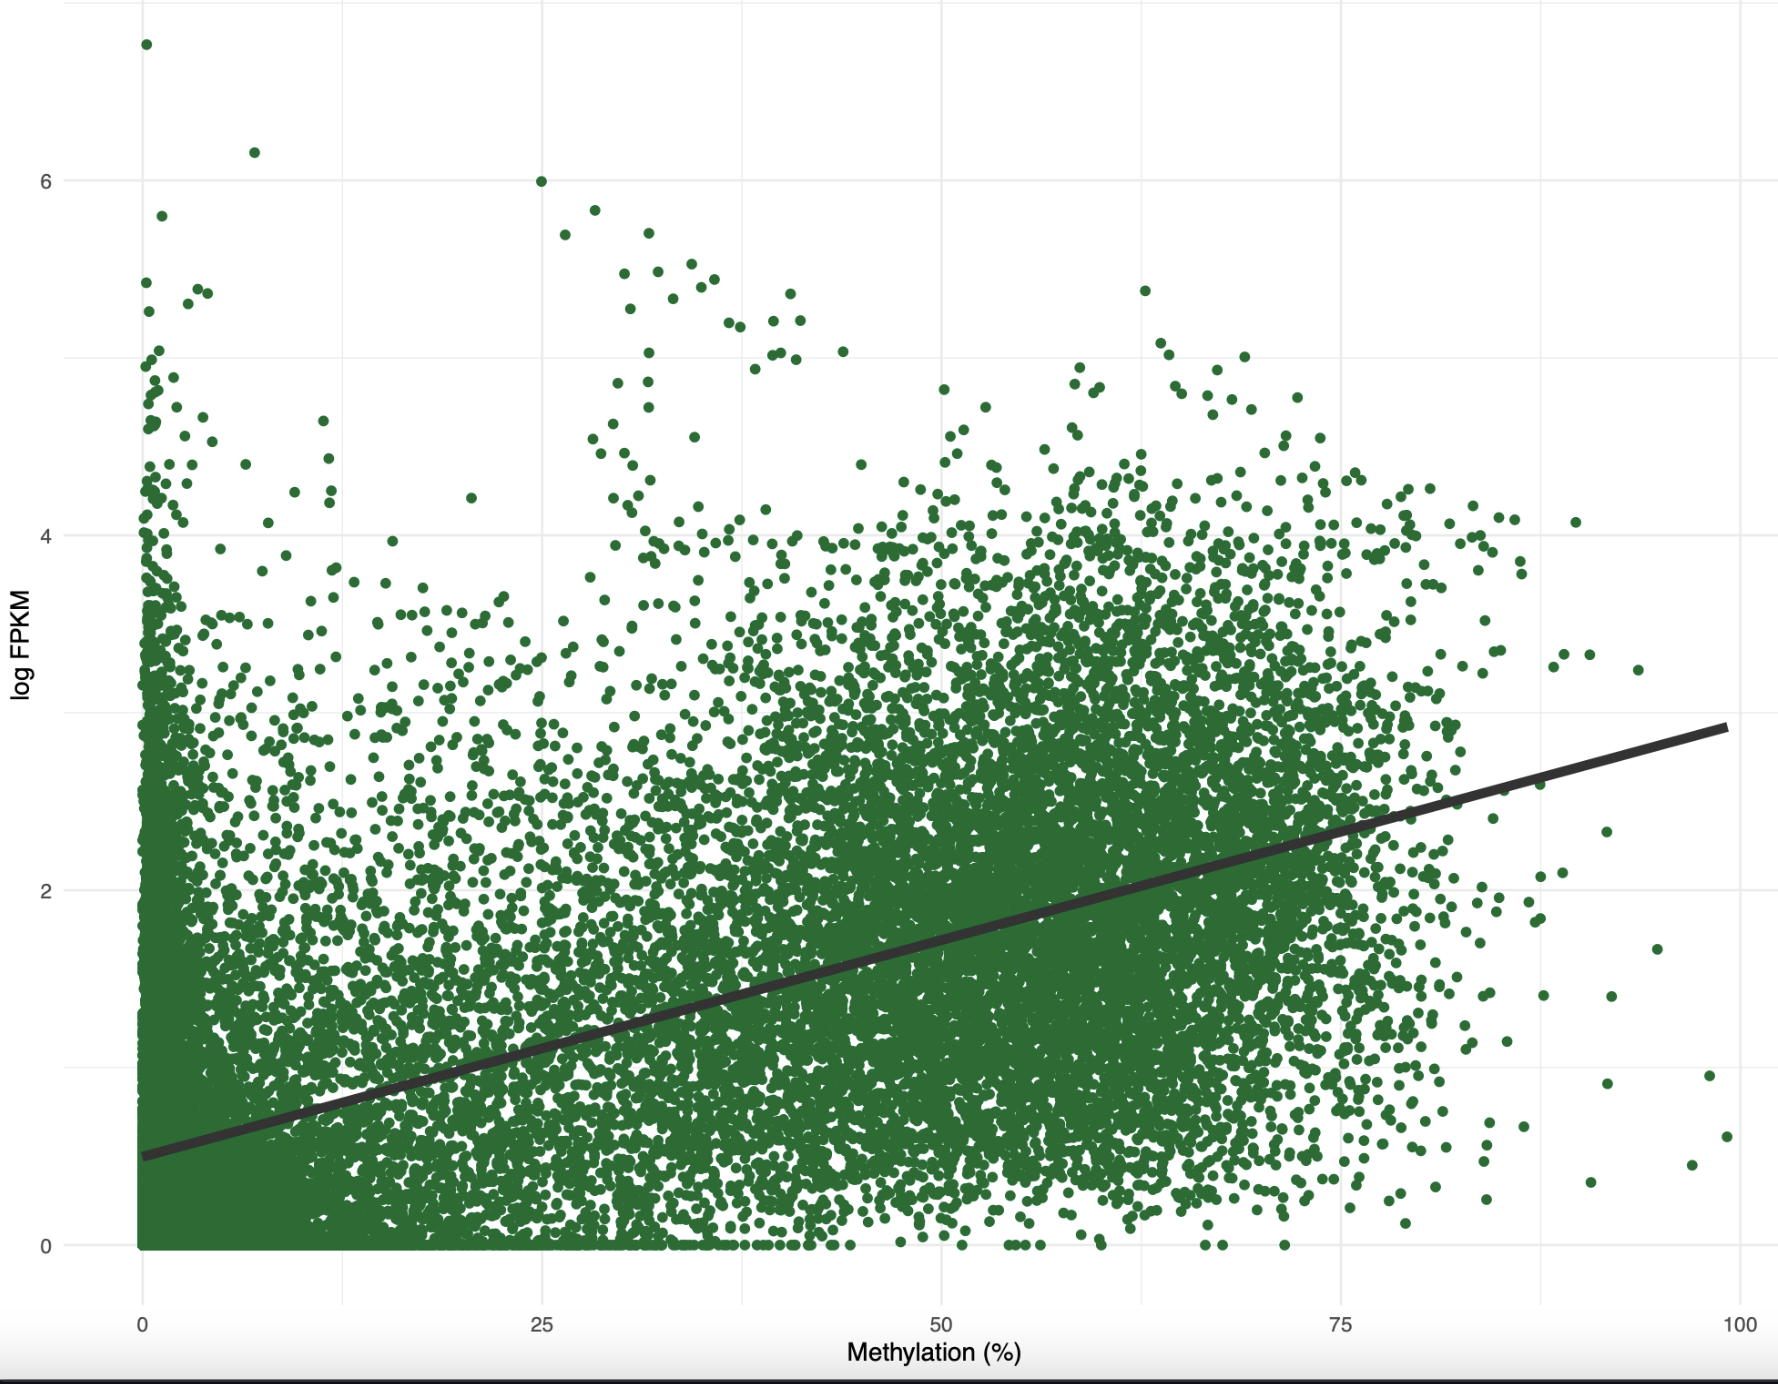
Figure 3. Percent methylation by log FPKM for genes with a predominant isoform shift
Based on this figure, I think I need to dig more into the predominant isoform analysis. For example, what is the methylation difference for genes with a predominant isoform shift? Does the predominant isoform always get shorter or longer? What is the expression difference for these genes? Do genes with a predominant isoform shift always have more or less isoforms expressed? What about overlaps with SNPs, TEs, or lncRNA? Are DML concentrated in these genes? Since there are significantly less genes with a predominant isoform shift than I expected, I suspsect it’s a good gene expression phenotype to look into. I need to think more about specific hypotheses that I can test. Additionally, I want to figure out the best way to model if a chance in methylation can predict whether or not there’s a shift in the predominant isoform or number of isoforms expressed.
Transcriptional noise analysis
The next thing I did was revisit the transcriptional noise analysis Shelly and I started! I decided to ignore the fact that we couldn’t figure out if CV was significantly different between treatments and focus on integrating methylation and expression. I used CV as a proxy for transcriptonal noise in a linear model based on Wu et al. 2020:
transNoiseFem <- lm(data = femMethExpCV,
                    log10(CoV_FPKM) ~ meth + log2(exp + 1) + log10(length) + as.factor(treatment))
All factors were significant in predicting CV! My only concern is that the methylation and expression data are sample-based, whereas the CV data is treatment-based. I will dig into the paper further to see if I can find the code for their analysis and ensure my dataframes are formatted similarly. I also want to perform a variance partioning analysis to determine which factor(s) has the most influence on my result.
Going forward
- Tune sPLS parameters
- Determine if outlier sample should be removed
- Re-run sex-specific SPLS
- Update methods and results
- Dig into functional annotations for genes in networks
- Investigate other layers of predominant isoform analysis
- Redo transcriptional noise analysis with treatment-level methylation and expression information
- Perform variance partitioning for transcriptional noise