Correlating Technical Replicates Part 10
The end of a saga
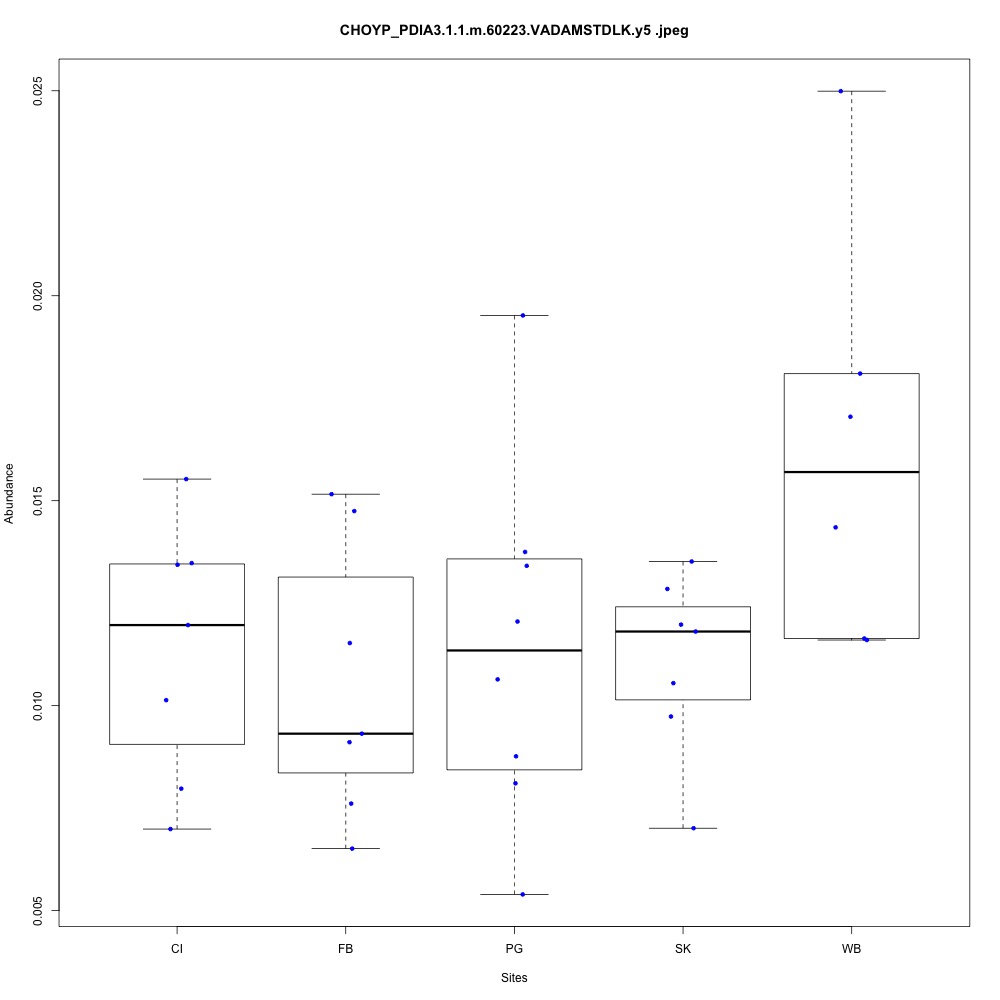
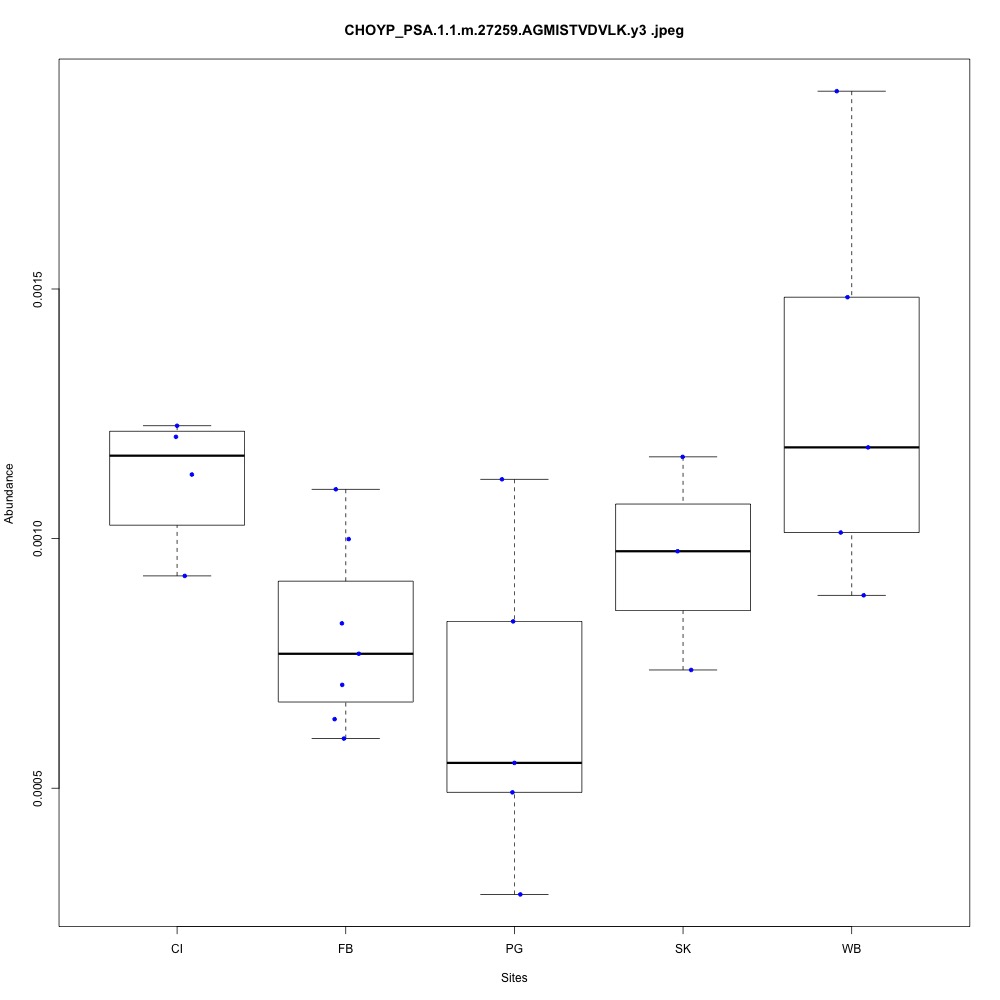
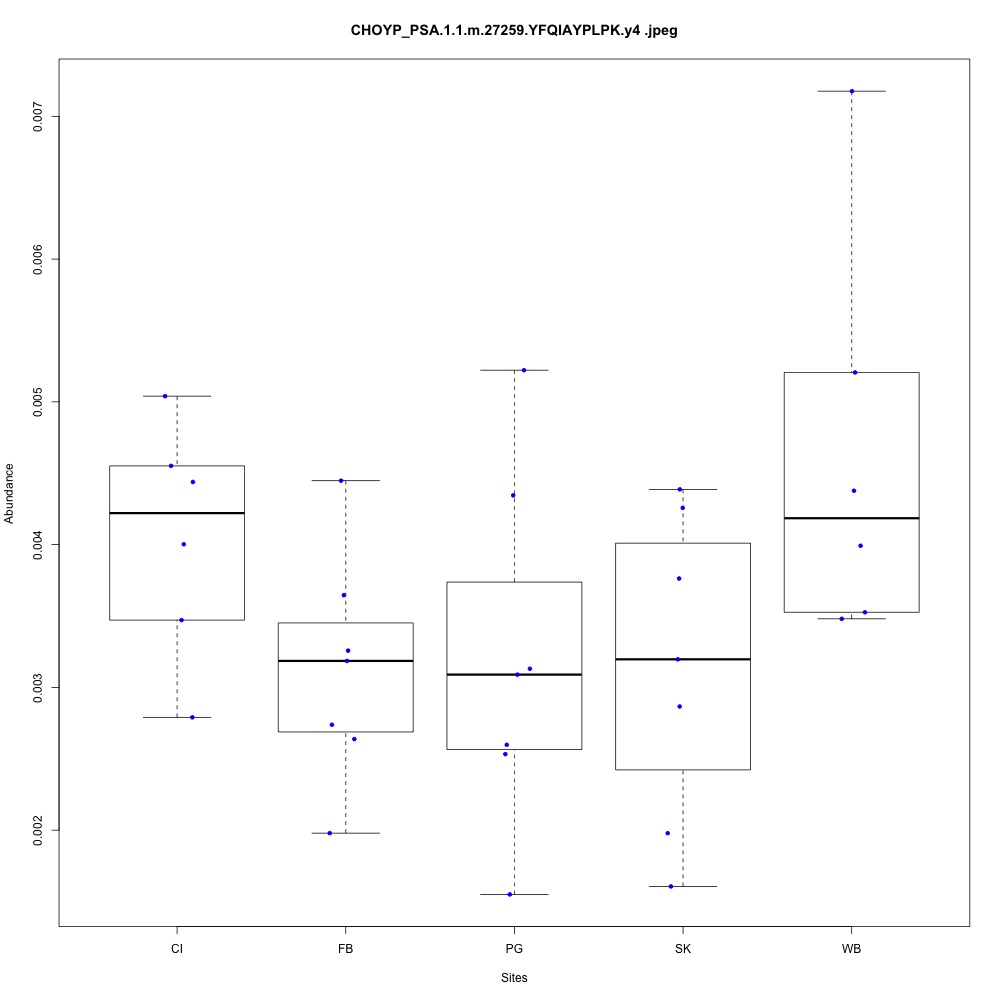
I think I’m at a point where I kind of trust my new dataset with bad samples removed. Within each peptide, all transitions show a consistent expression pattern between sites. Peptides within a protein, however, have different expression. This could be due to alternative splicing.
There are three different patterns I saw with my protein expression data:
- Puget Sound sites had similar expression values, but Willapa Bay had higher expressoin
- There’s a U-shape (CI –> FB –> PG (minimum) –> SK –> WB)
- All five expression values are similar
For my future reference, I’m going to paste my boxplots from one transition per peptide below. I’ve sorted proteins by their functions.
Oxidative Stress (4 proteins)
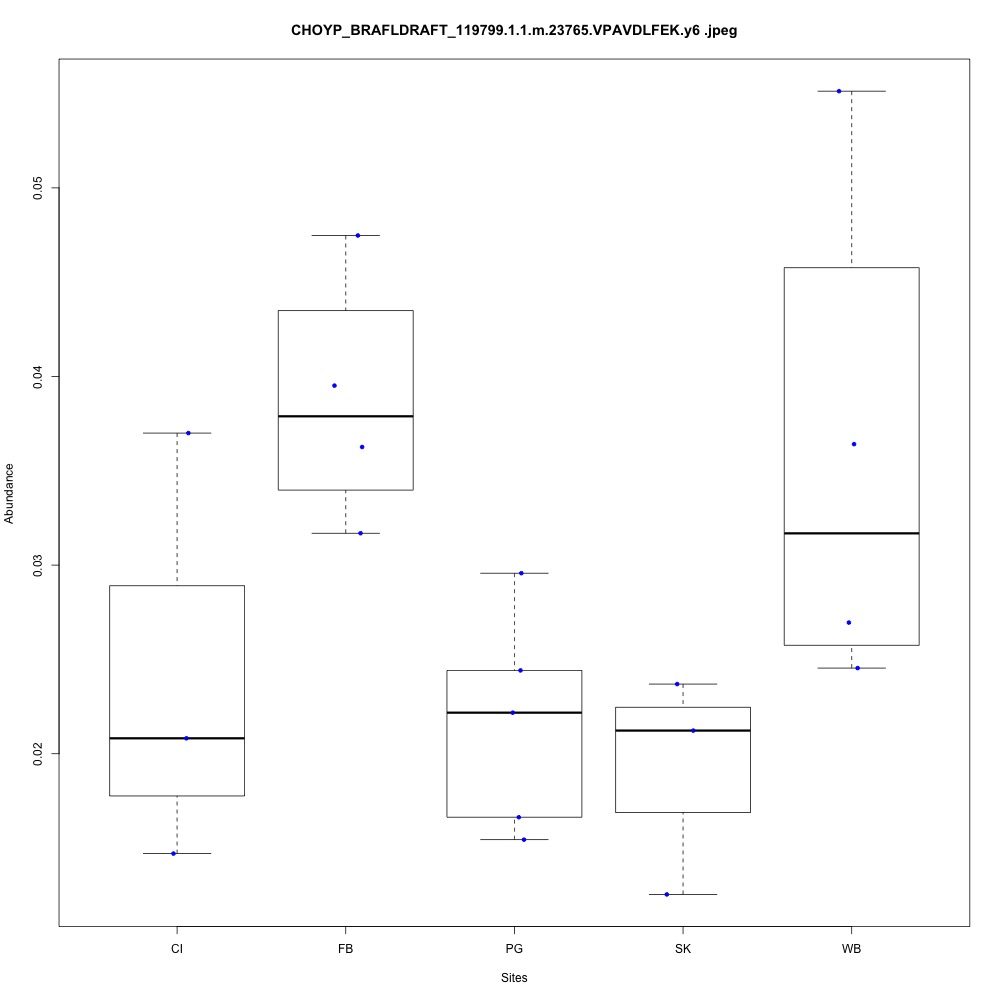
| **CHOYP_BRAFLDRAFT_119799.1.1 | m.23765**: Peroxiredoxin-5, mitochondrial (EC 1.11.1.15) |

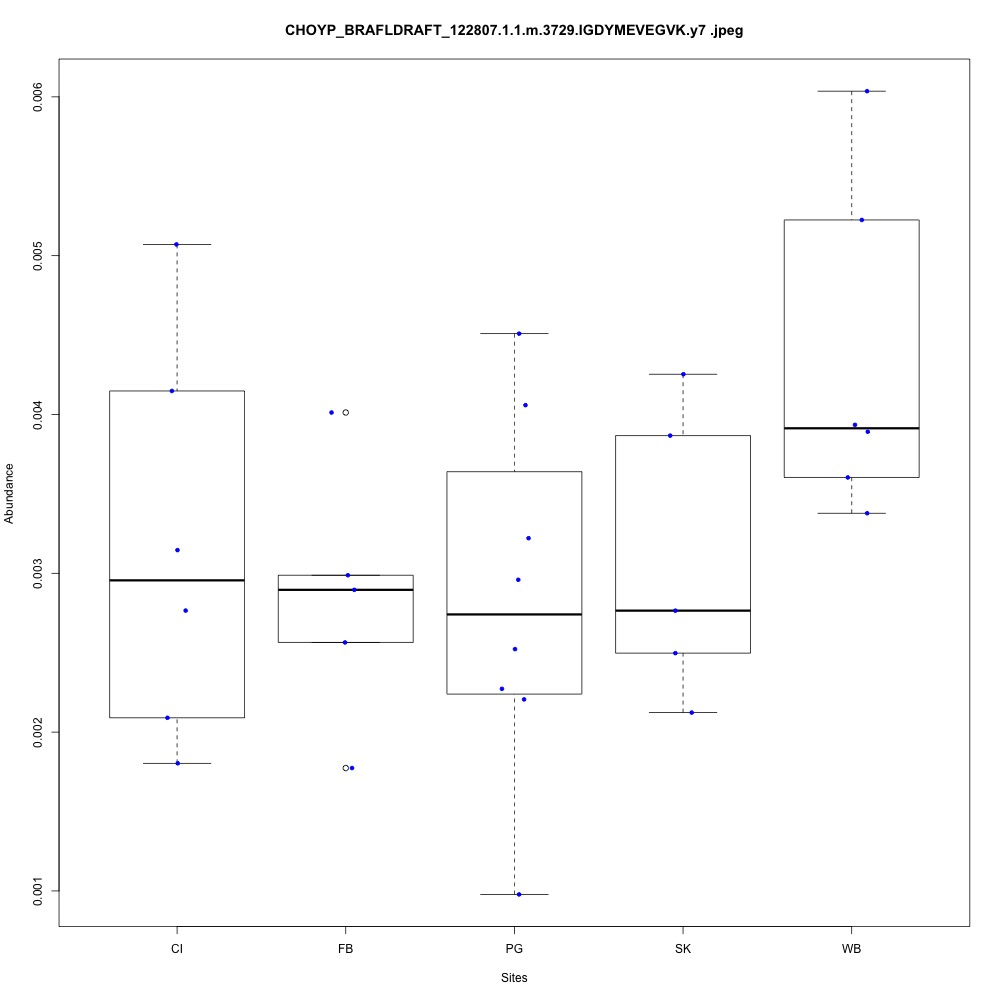
| **CHOYP_BRAFLDRAFT_122807.1.1 | m.3729**: Thioredoxin reductase 3 (EC 1.8.1.9) |


| **CHOYP_CATA.1.3 | m.11120**: Catalase (EC 1.11.1.6) |


| **CHOYP_CATA.3.3 | m.21642**: Catalase (EC 1.11.1.6) |

Heat shock (1 protein)
| **CHOYP_HS12A.25.33 | m.60352**: Heat shock 70 kDa protein 12B |


Acid-base balance (1 protein)
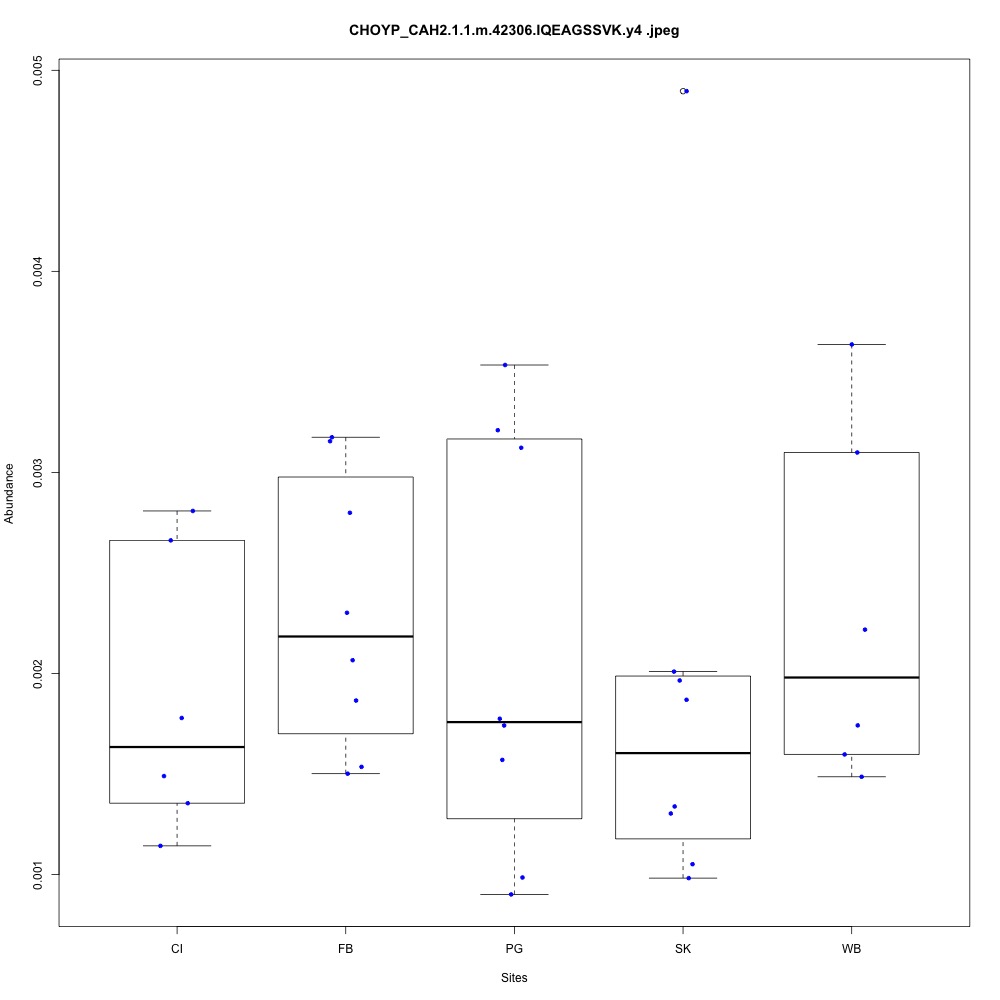
| **CHOYP_CAH2.1.1 | m.42306**: Carbonic anhydrase 2 (EC 4.2.1.1) |


Drug resistance (1 protein)
| **CHOYP_MRP1.5.10 | m.34368**: Multidrug resistance-associated protein 1 (ATP-binding cassette sub-family C member 1) |


Fatty acid metabolism (1 protein)
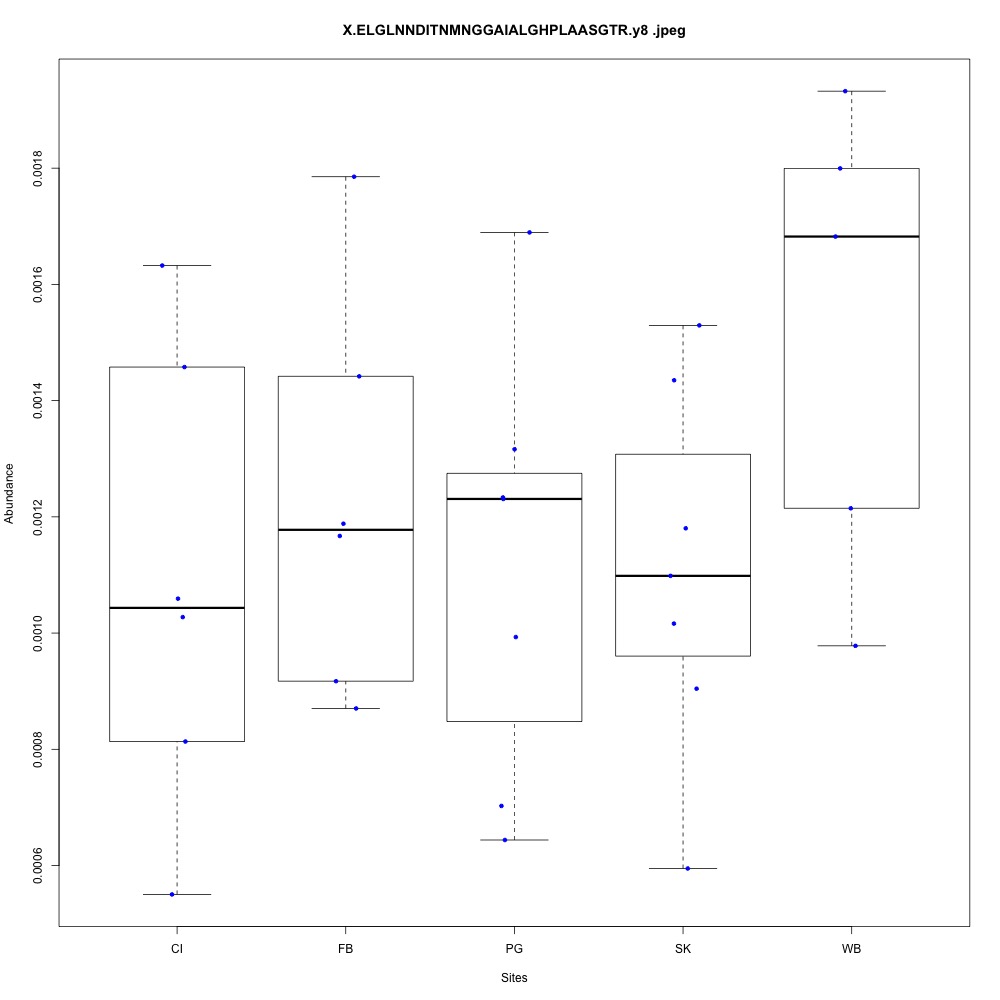
| **CHOYP_ACAA2.1.1 | m.30666**: 3-ketoacyl-CoA thiolase, mitochondrial (EC 2.3.1.16) |


Carbohydrate metabolism (2 proteins)
| **CHOYP_G6PD.2.2 | m.46923**: Glucose-6-phosphate 1-dehydrogenase (G6PD) (EC 1.1.1.49) |


| **CHOYP_LOC100883864.1.1 | m.41791**: Glycogen phosphorylase, muscle form (EC 2.4.1.1) |


Cell growth and maintenance (5 proteins)
| **CHOYP_BRAFLDRAFT_275870.1.1 | m.12895**: Protein phosphatase 1B (EC 3.1.3.16) |


| **CHOYP_LOC100633041.1.1 | m.35428**: NAD(P) transhydrogenase, mitochondrial (EC 1.6.1.2) |


| **CHOYP_PDIA1.1.1 | m.5297**: Protein disulfide-isomerase (PDI) (EC 5.3.4.1) |


| **CHOYP_PDIA3.1.1 | m.60223**: Protein disulfide-isomerase A3 (EC 5.3.4.1) |


| **CHOYP_PSA.1.1 | m.27259**: Puromycin-sensitive aminopeptidase (PSA) (EC 3.4.11.14) |

Written on November 1, 2017