
Correlating Technical Replicates Part 2
Step 1: R-squared Cutoffs
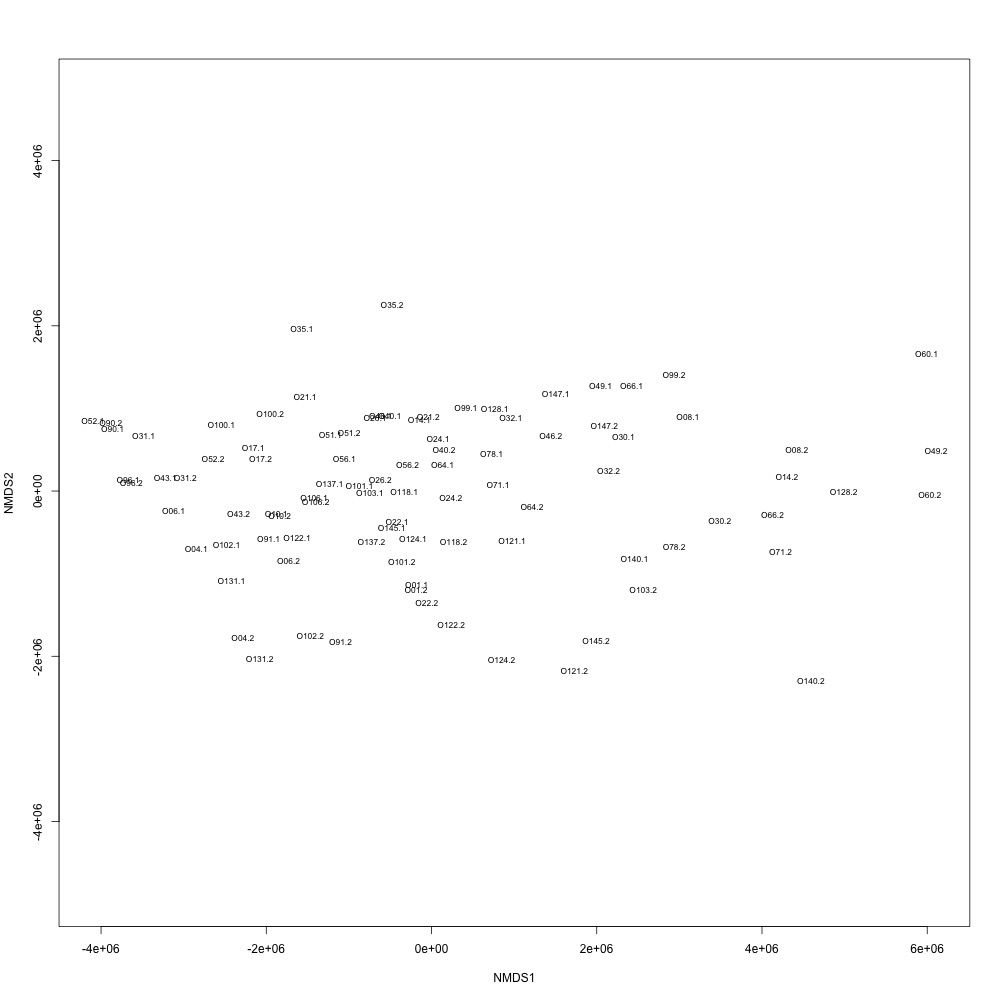
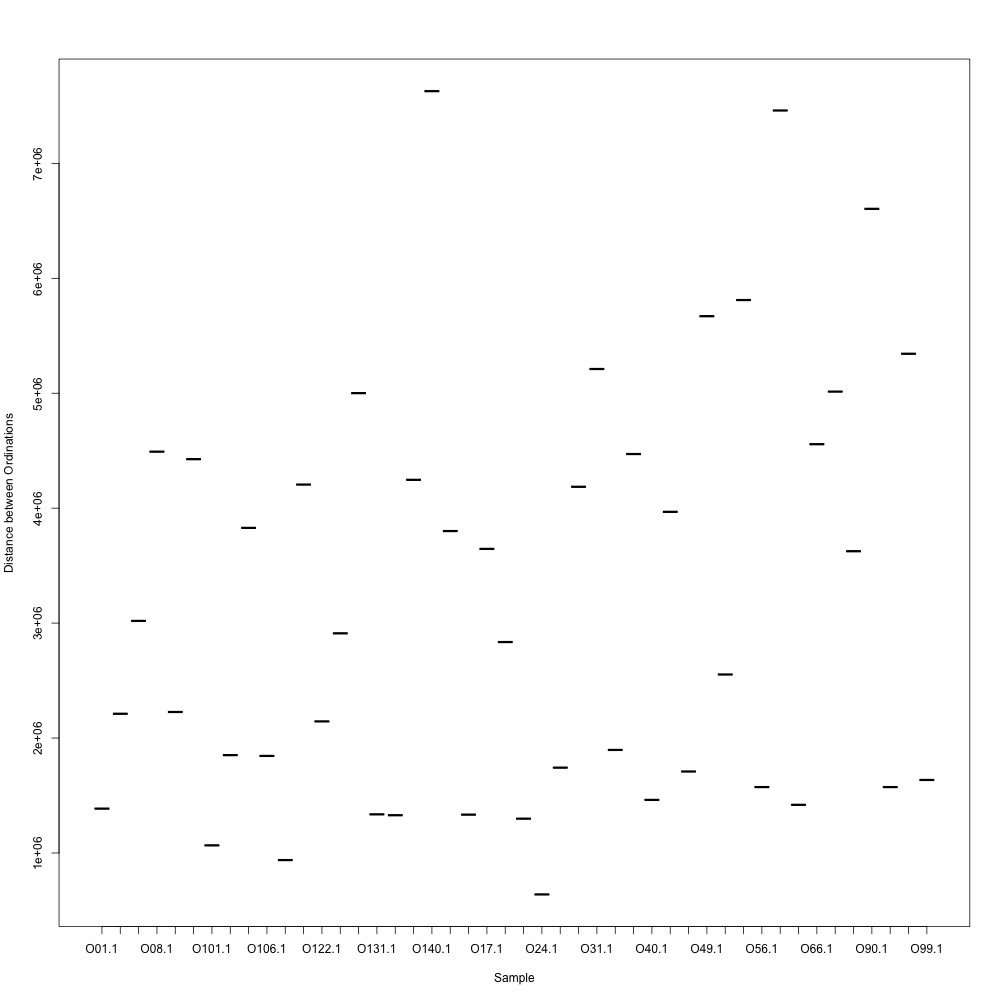
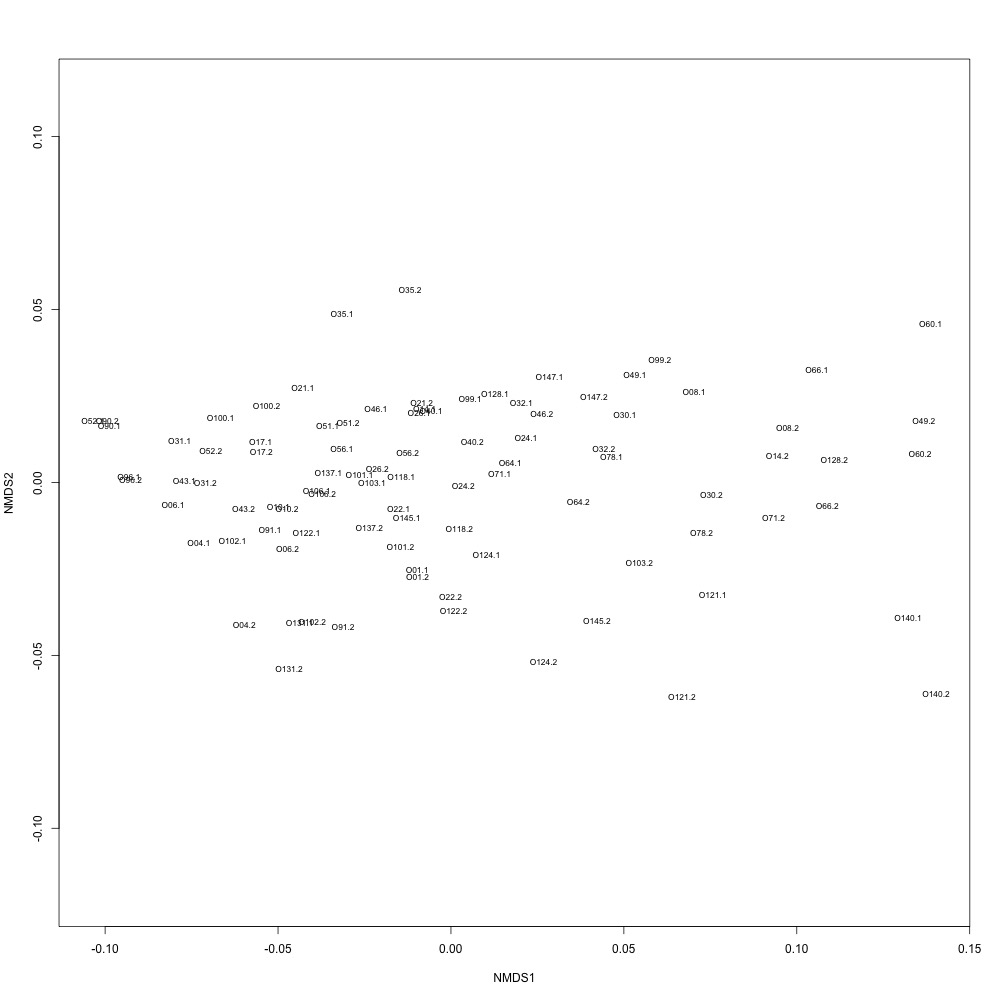
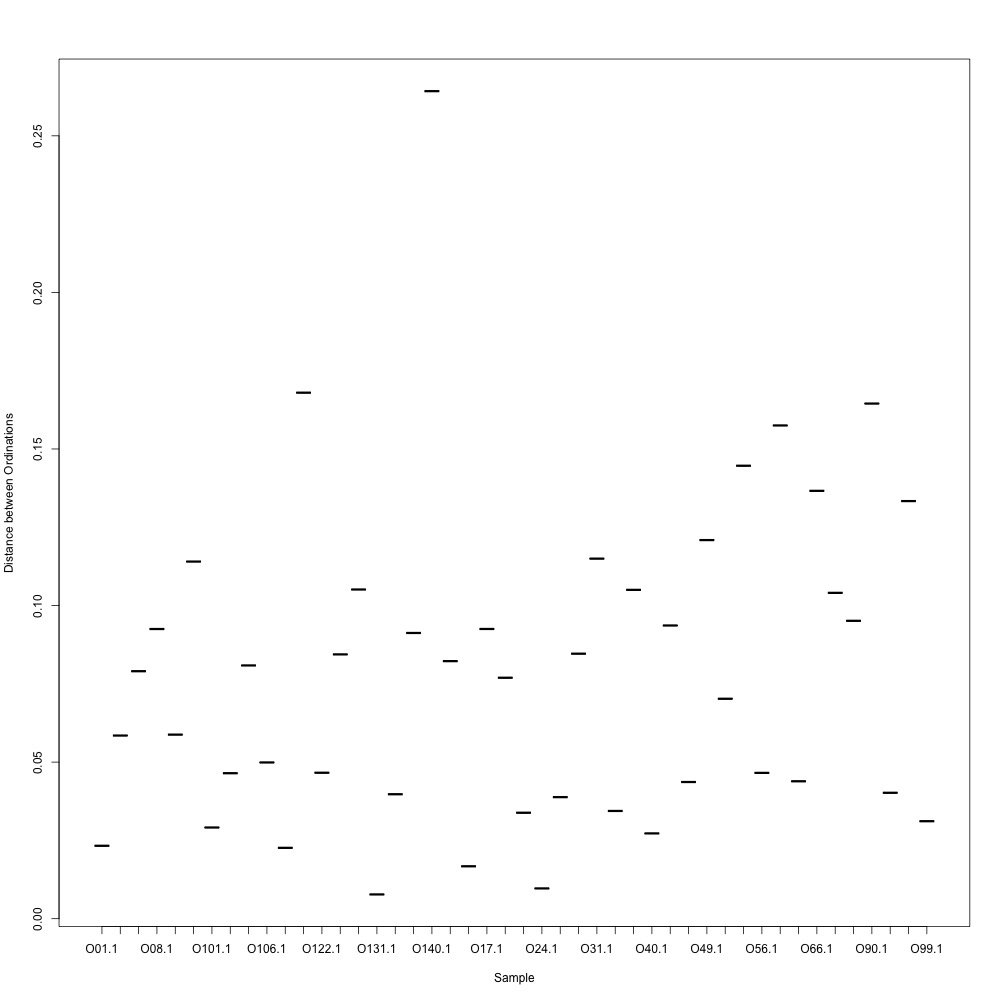
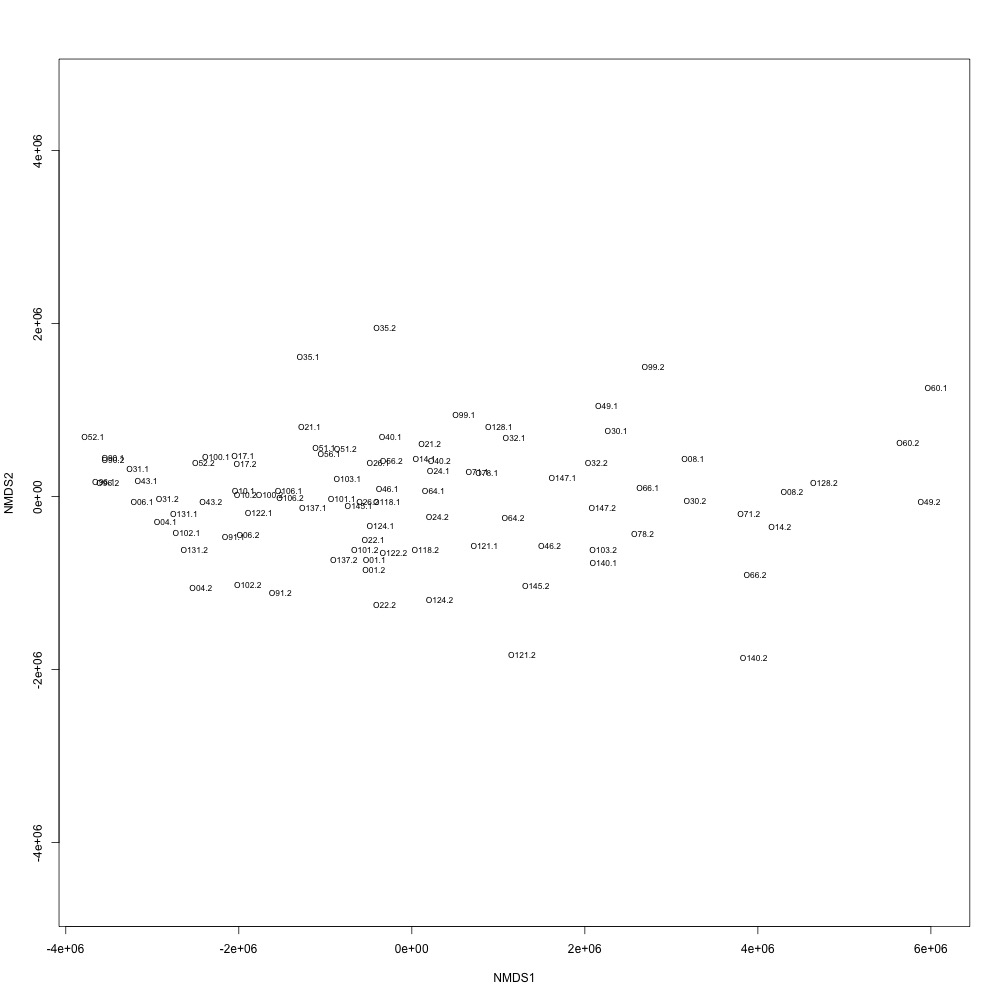
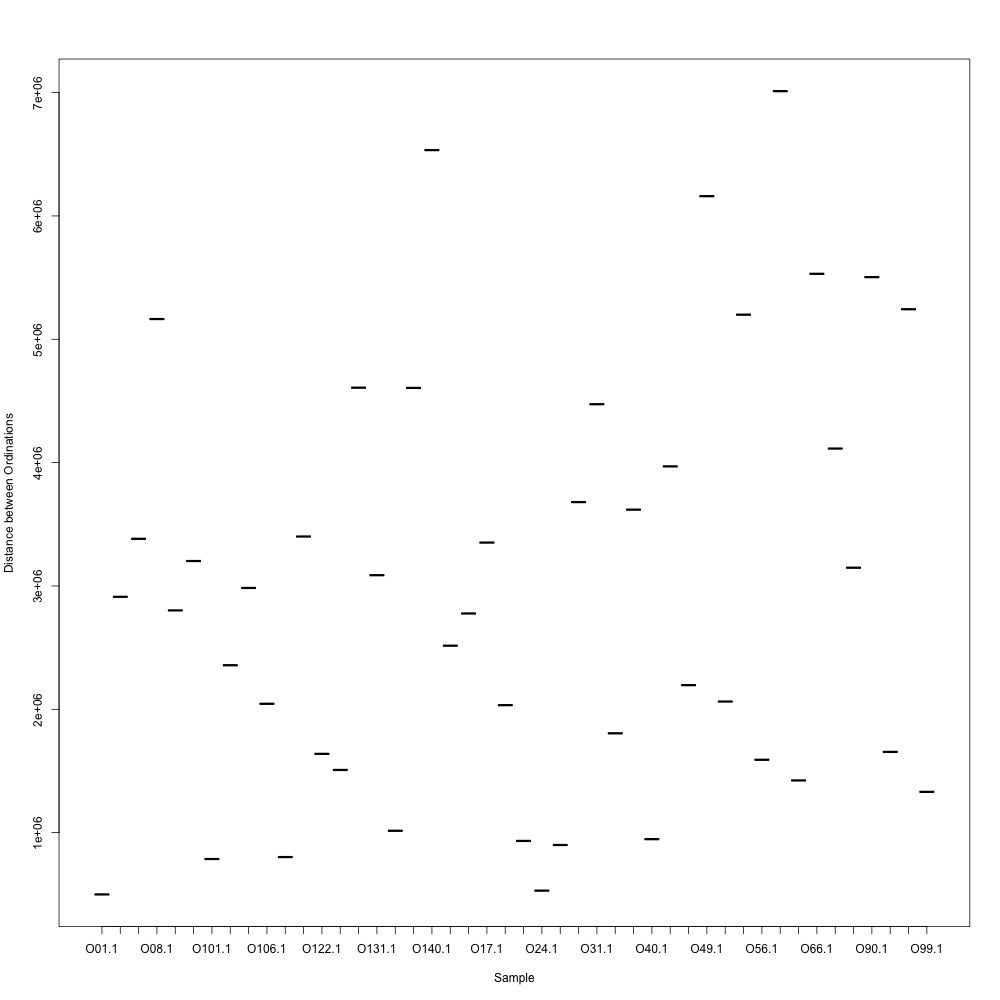
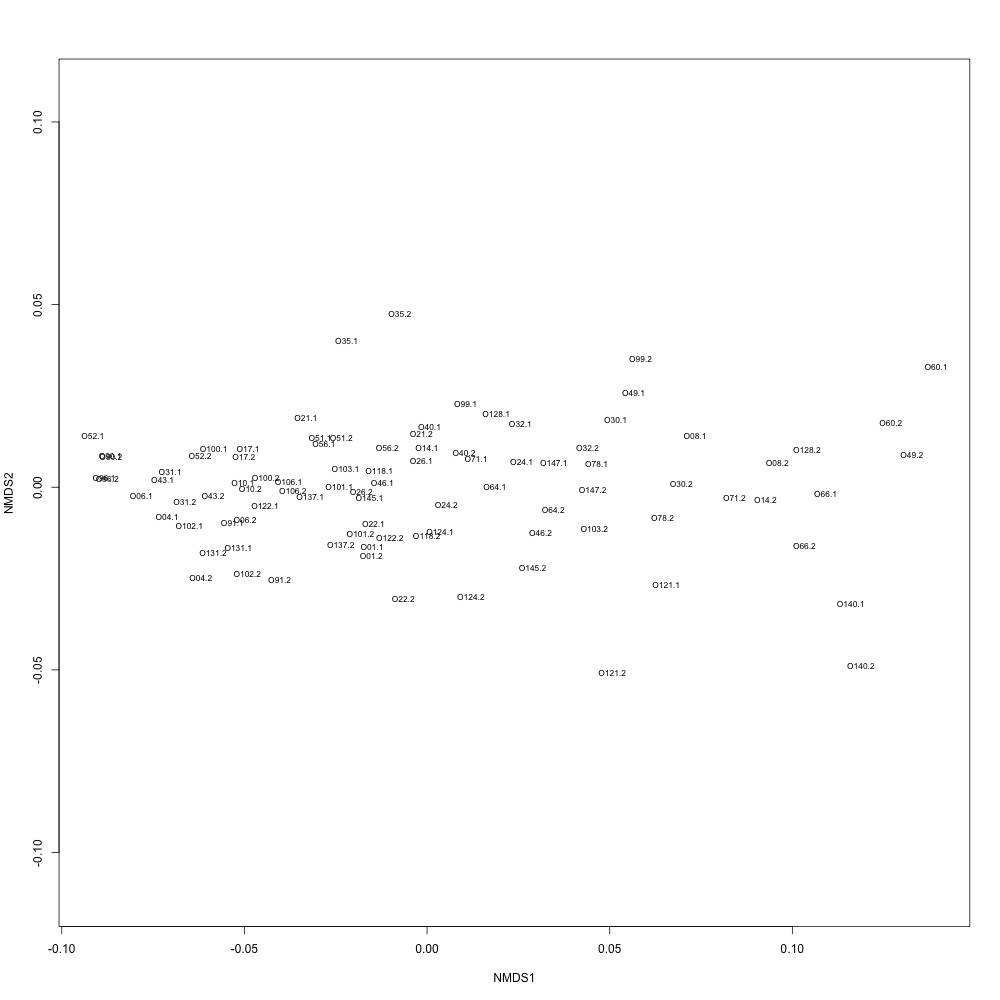
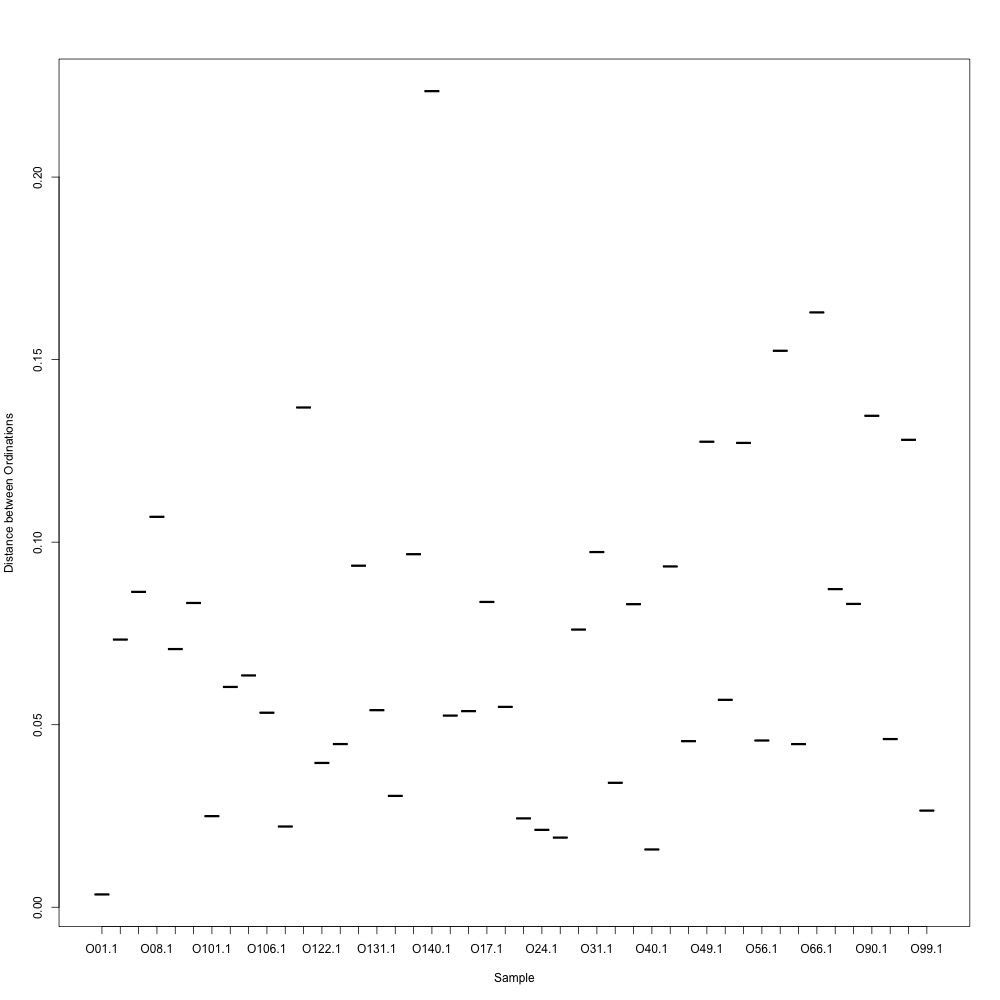
In this R script, I used three different R-squared cutoffs to weed out transitions and reexamine my technical replication. I tried the combinations of normalized and nonnormalized data with different cutoffs. I made NMDS plots for each option and calculated the distances between my technical replicates. I eliminated any and all transitions that had adjusted R-squared values below the cutoff.
Cutoff = 0.6, nonnormalized data:
Cutoff = 0.6, normalized data:
Cutoff = 0.7, nonnormalized data:
Cutoff = 0.7, normalized data:
Cutoff = 0.8, normalized data:
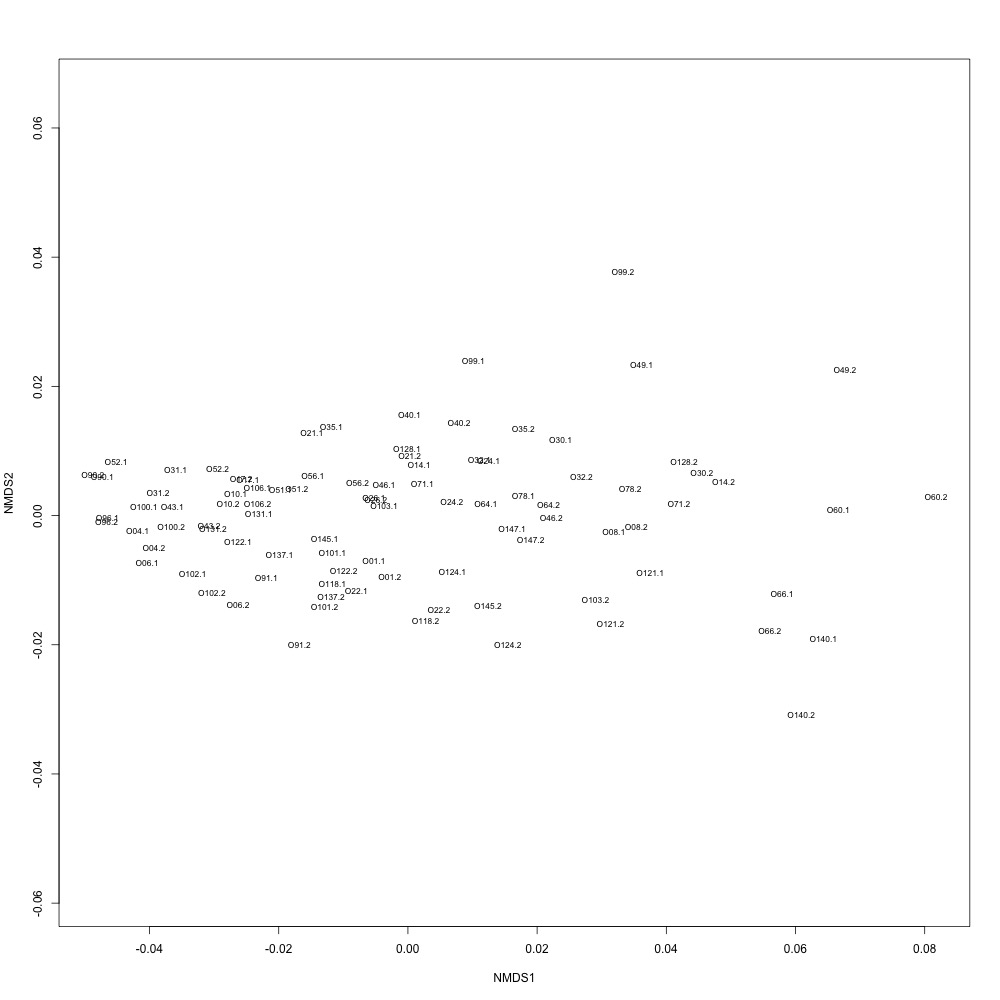
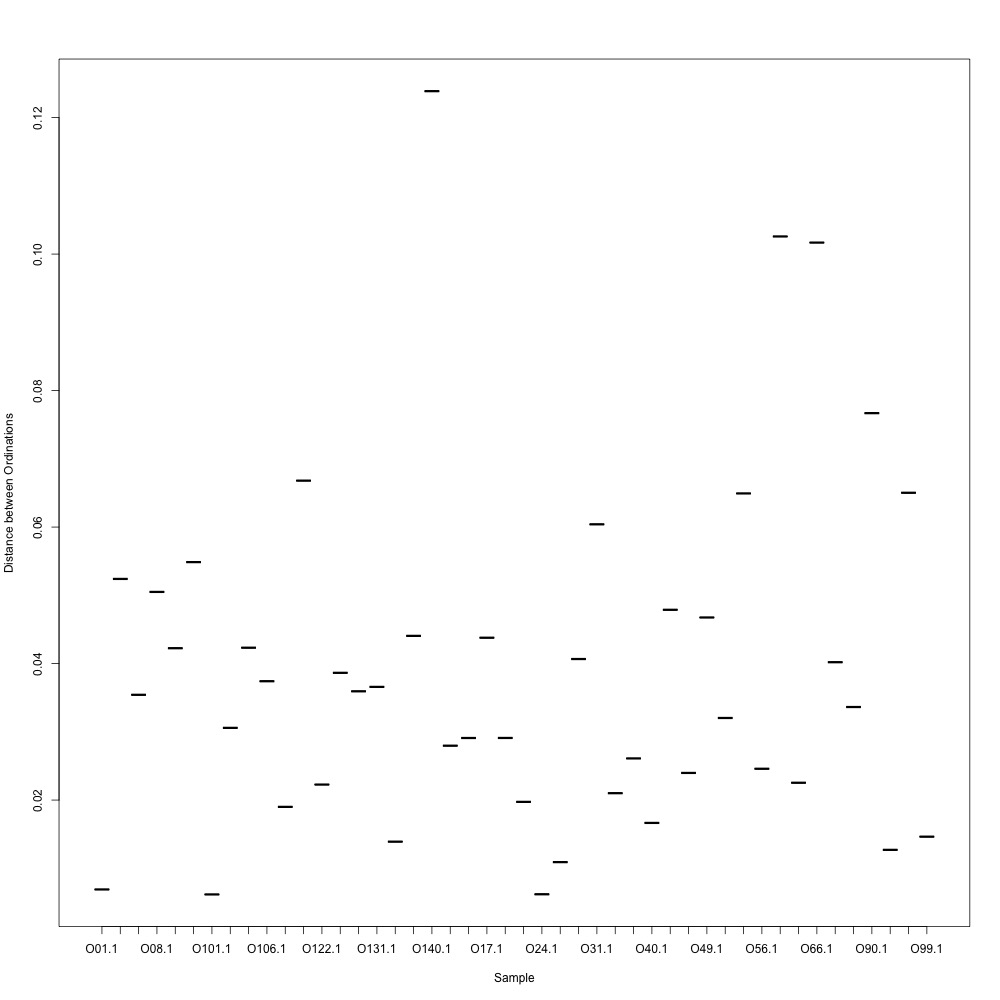
I found that normalizing my data made my NMDS plots look better, so I didn’t use an 0.8 cutoff with nonnormalized data. Overall, my NMDS plots looked better, but they’re still not fantastic. With a 0.6 cutoff, I had 88 transitions, 45 with a 0.7 cuttoff, and 17 with a 0.8 cutoff. I personally think the 0.7 cutoff is a happy medium between losing too much data on proteins and a better NMDS plot. I still need to try the x = y slope method outlined in this issue. For now I’ll update Emma and Steven and see what they think.