
Correlating Technical Replicates Part 3
I tried doing something statistically impossible today
Moving forward with my technical replicates, I’m working through Steven’s suggestion to plot an x = y line and create a confidence interval around that line. If there are transitions with more than 95% of points outside that confidence interval, I can discard that transition and continue with my analysis. Here are some issues with that approach I’m working through in this script:
-
When I looked at the formula for each transition’s regression line, I found that there were some pretty large intercepts. Therefore, an x = y line was far removed from my regression line. Possible solution: Normalize data and see if intercept issue is resolved. Emma suggested not normalizing data though, so I’ll have to confirm with her first. I could also try modeling without an intercept to begin with, but I have a feeling the intercept is statistically significant and should be included in the model.
-
I can’t create confidence intervals around lines with no error! Or, I can make confidence intervals, but if my MSE is close to zero, then my upper and lower confidence interval bounds are going to be right on top of the original line. If there’s no error to begin with, I can’t create it (hence the statistical impossibility)! Possible solution: I plotted a line where slope = 1 and intercept = regression intercept for each transition. Even though I generated this line, I think I may be able to calculate MSE between this new prediction line and my points so I can make a 95% confidence interval. There may also be a better workaround that I will consult about.
-
So far, the plots I’ve generated look like this:
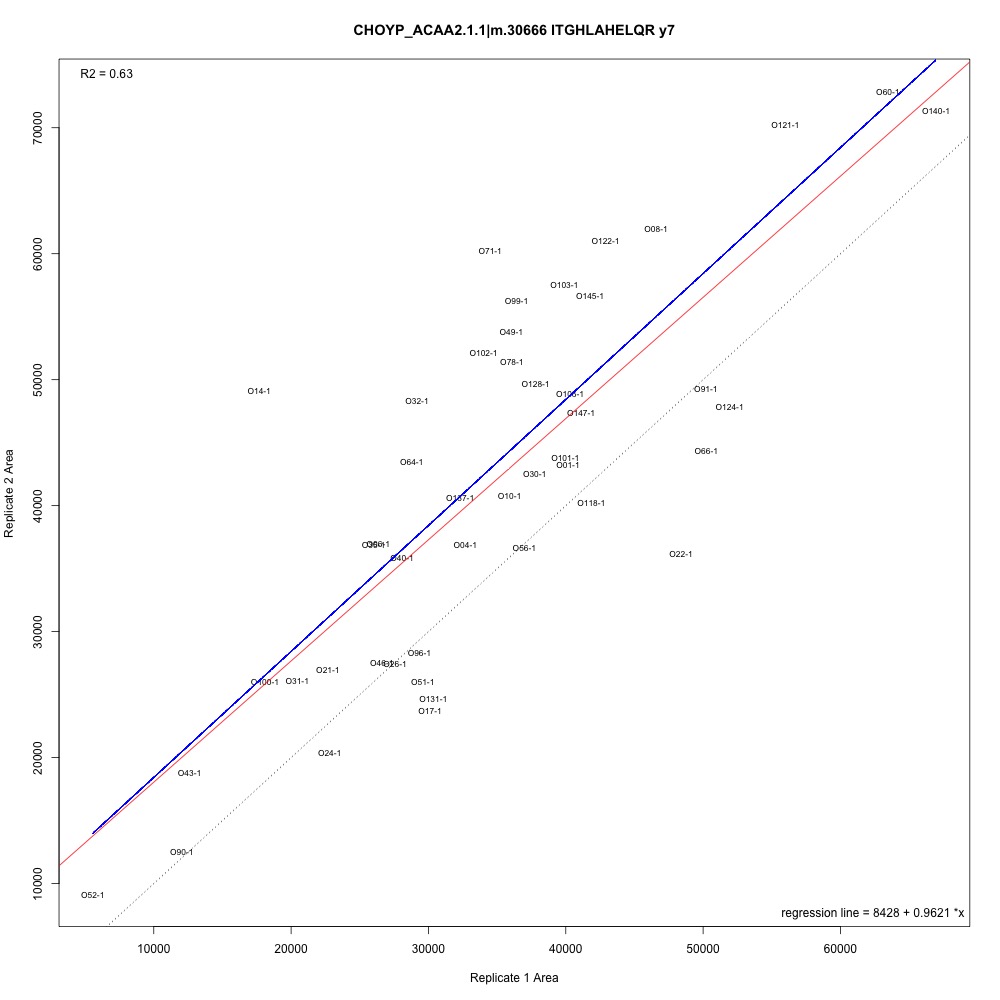
The red line is the regression line (first batch of technical replicates used to predict second batch), the blue line is the fitted line (same intercept as regression but a slope of 1), There’s valuable information there, but I’m still figuring out a good way to interpret it. Possible solution: Try to just eliminate transitions outside of a certain cutoff (1 ± some undetermined error) and make NMDS plots.
I’m not sure what the best approach is here, so I will consult with Emma and Steven. To the issues!