
Correlating Technical Replicates Part 7
I finally have technical replication I kinda trust?!
What a relevation to have right as the sun made an appearance on a cloudy day! As I mentioned in my previous post, I decided to filter down my transitions using different coefficient of variation levels in an effort to improve my technical replication. In this script, I only included transitions with a coefficient of variation less than or equal to 10. Look at the technical replication I got:
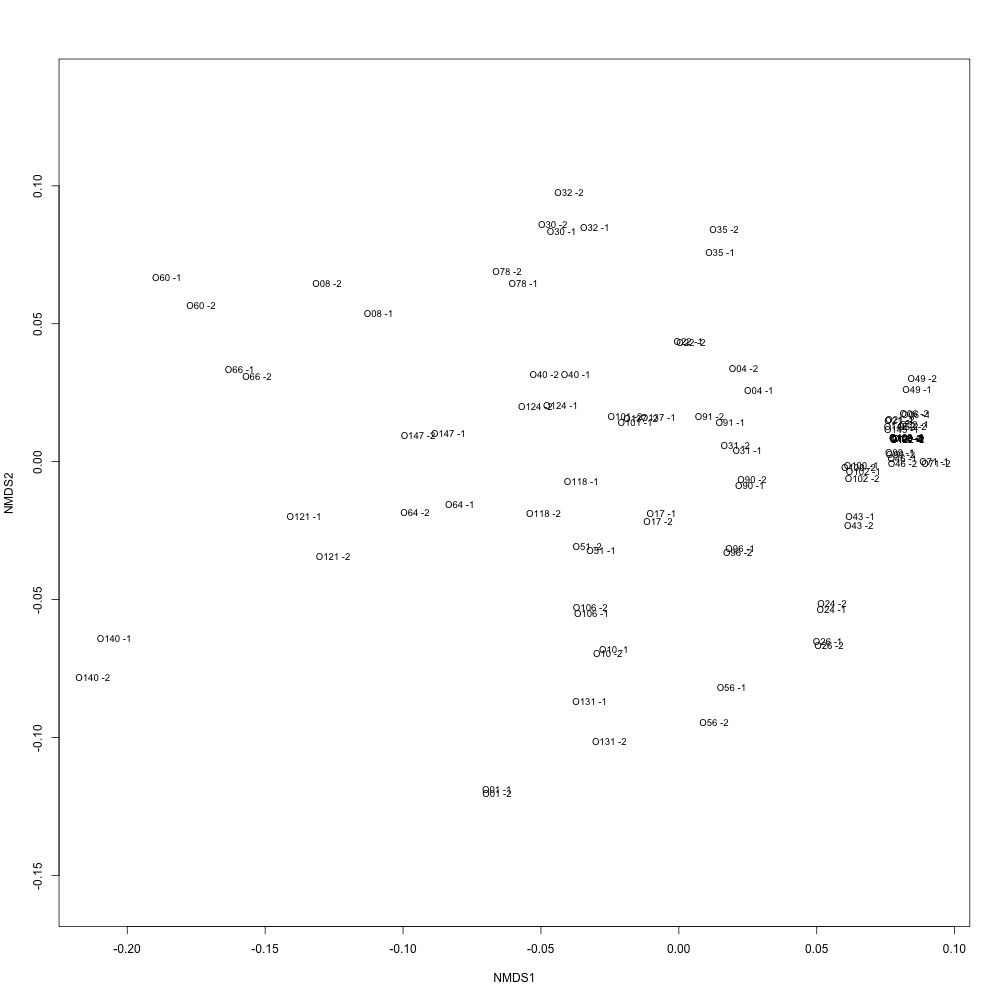
Figure 1. Technical replication after using a coefficient of variation maximum of 10.
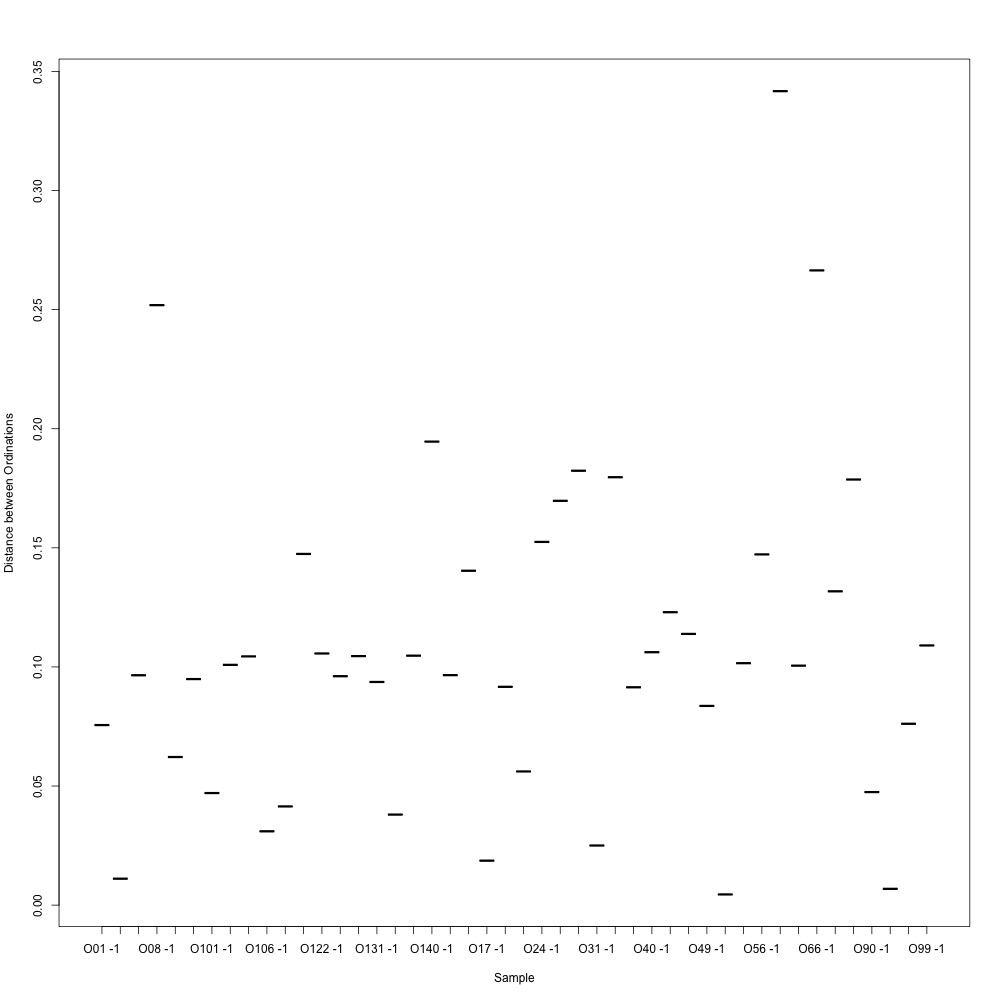
Figure 2. Ordination distances between technical replicates.
It’s probably the best technical replication I’ve gotten with my data so far, and I kind of trust it! Obviously not thinking too hard about why certain transitions vary more than others and I didn’t ensure that each protein included in this had at least two peptides (and each peptide had at least two transitions), but this is some exciting stuff after a long slug of data yuckiness.
Using this dataset, I averaged my technical replicates and remade an NMDS plot to look at clustering by site and eelgrass in this script. Once again, there were no obvious patterns. My ANOSIM was also not significant (but hey, maybe it’s a statistically sound nonsignificant result and I am on board with that).
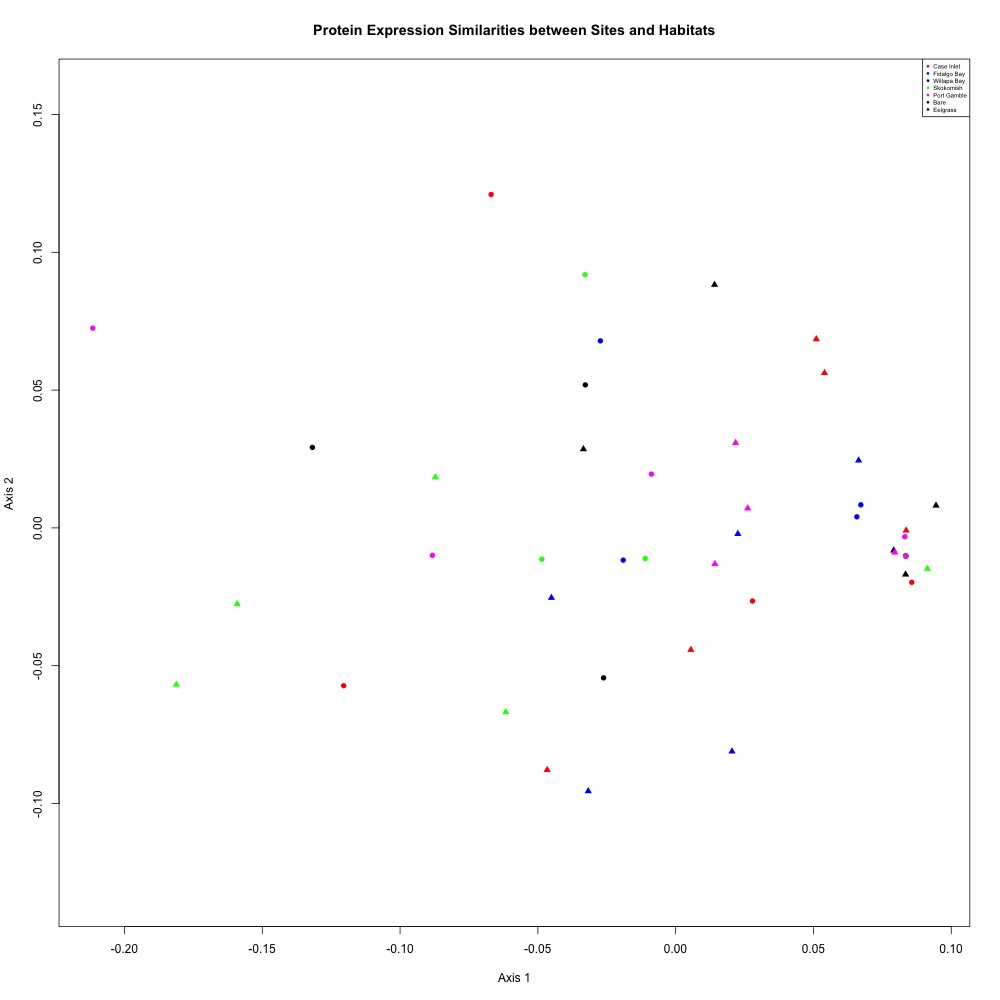
Figure 3. NMDS for assessing similarities between sites and habitats.
I also weeded out technical replicates with the highest ordination distances from Figure 1 and remade my NMDS for technical replication.
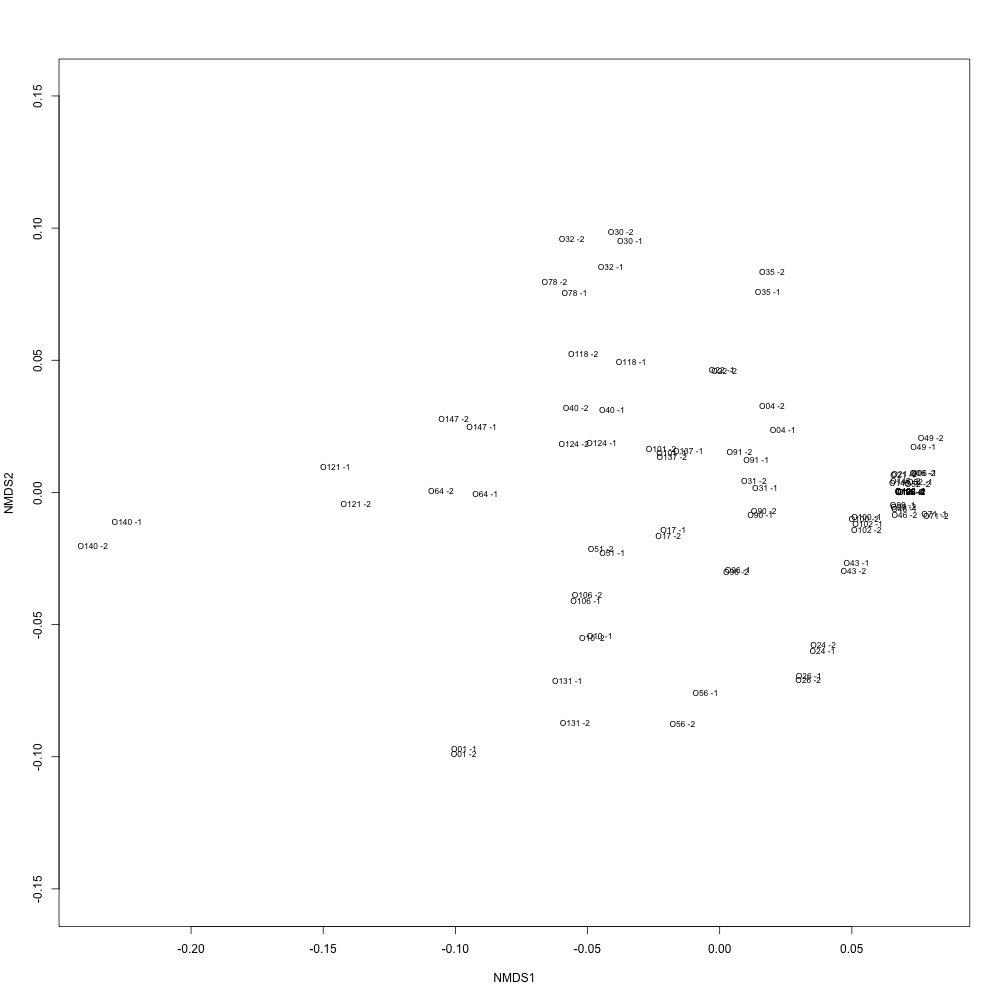
Figure 4. Technical replication after using a coefficient of variation maximum of 10 and removing any technical replicates with ordination distances greater than 0.2.
I also reran my cluster analysis and ANOSIM and found no differences in significance.
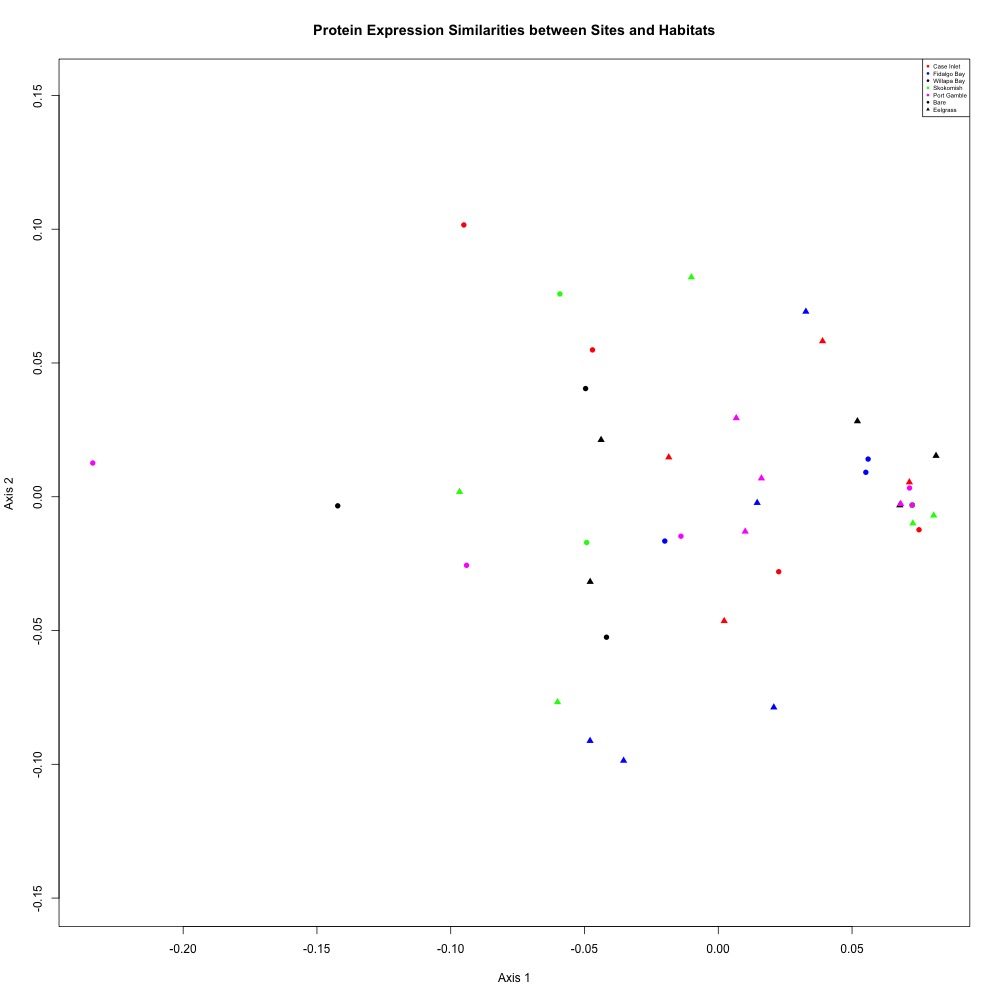
Figure 5. NMDS for assessing similarities between sites and habitats after eliminating technical replicates with large ordination distances.
I used the same process but with a coefficient of variation maximum of 15 in this script and this one, but having a threshold of 10 was much better.
My next step is to make boxplots for all of my transitions and to look at the transition list I used for the above plots to make sure that I’m not including any proteins without the appropriate number of peptides (and peptides without the appropriate number of transitions).