
DML Analysis Part 13
Different mincov values in methylKit
Using this R Markdown file, I tested the effect of different mincov values on sample clustering and DMLs produced. After dicsussing methods in this issue, I went through this process with both Steven’s samples and my own samples.
Steven’s samples
All of my output from this analysis can be found here. Below are some highlights:


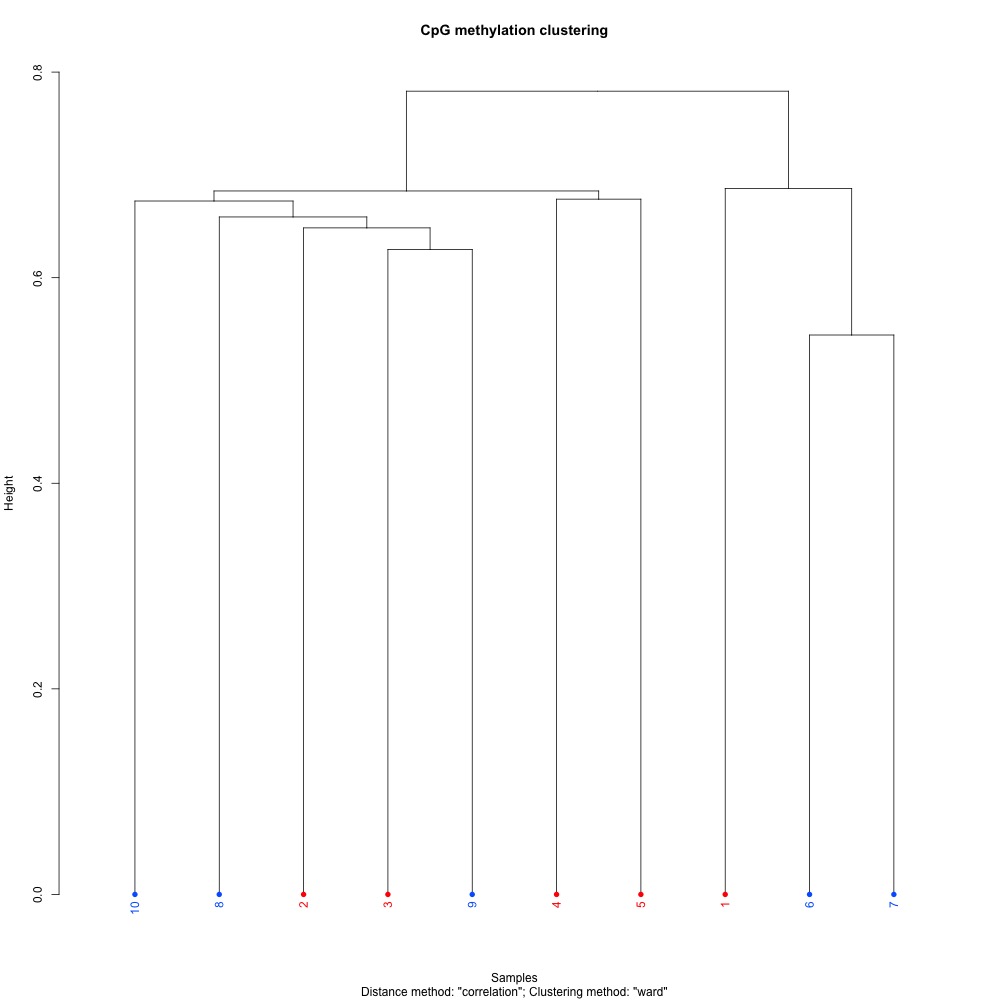
Figures 1-3. Full sample CpG methylation clustering using a) mincov = 1 b) mincov = 3 or c) mincov = 5.


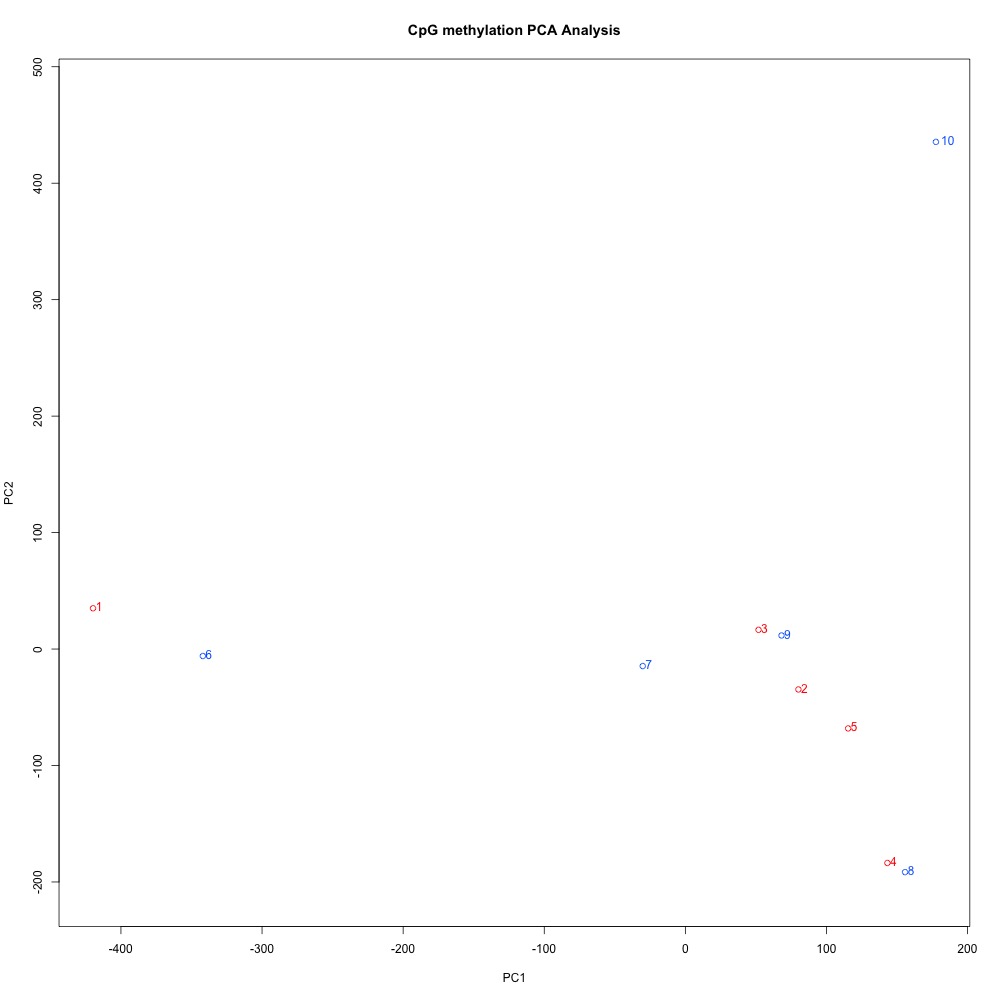
Figures 4-6 PCA of full sample methylation using a) mincov = 1 b) mincov = 3 or c) mincov = 5.
I also wrote out differentially methylated loci that were at least 50% different between my treatment and control for mincov = 1, mincov = 3, and mincov = 5. I haven’t dug into what the exact differences are between these files, but there are at least differences in the number of DMLs produced.
Table 1. The mincov metric, total number of loci produced, and the number of DMLs that were at least 50% different between treatment andc control samples. More restrictive mincov metrics produced less significantly different DMLs.
mincov |
Total Loci | Number of Significantly Different DMLs |
|---|---|---|
| 1 | 1112085 | 4904 |
| 3 | 670301 | 1398 |
| 5 | 503780 | 816 |
One thing that was concerning about the pipeline is that I kept getting this error:
glm.fit: fitted probabilities numerically 0 or 1 occurredglm.fit: fitted probabilities numerically 0 or 1 occurredglm.fit: fitted probabilities numerically 0 or 1 occurred
My samples
I went through the bismark pipeline in my Jupyter notebook to get my deduplicated and sorted files. Initially I tried using bismark_methylation_extractor, but I was unable to extract methylation data for all files before genefish ran out of space (again…RIP). I moved all my large files to gannet and decided it probably wasn’t worth extracting the methylation data from genefish since I already have the pipeline running on Mox. If I have some downtime, I can always change the code so I’m running bismark_methylation_extractor from gannet.
All output from methylKit testing for my samples can be found here. I also wrote .csv files with DMLs for mincov = 1, mincov = 3, and mincov = 5.
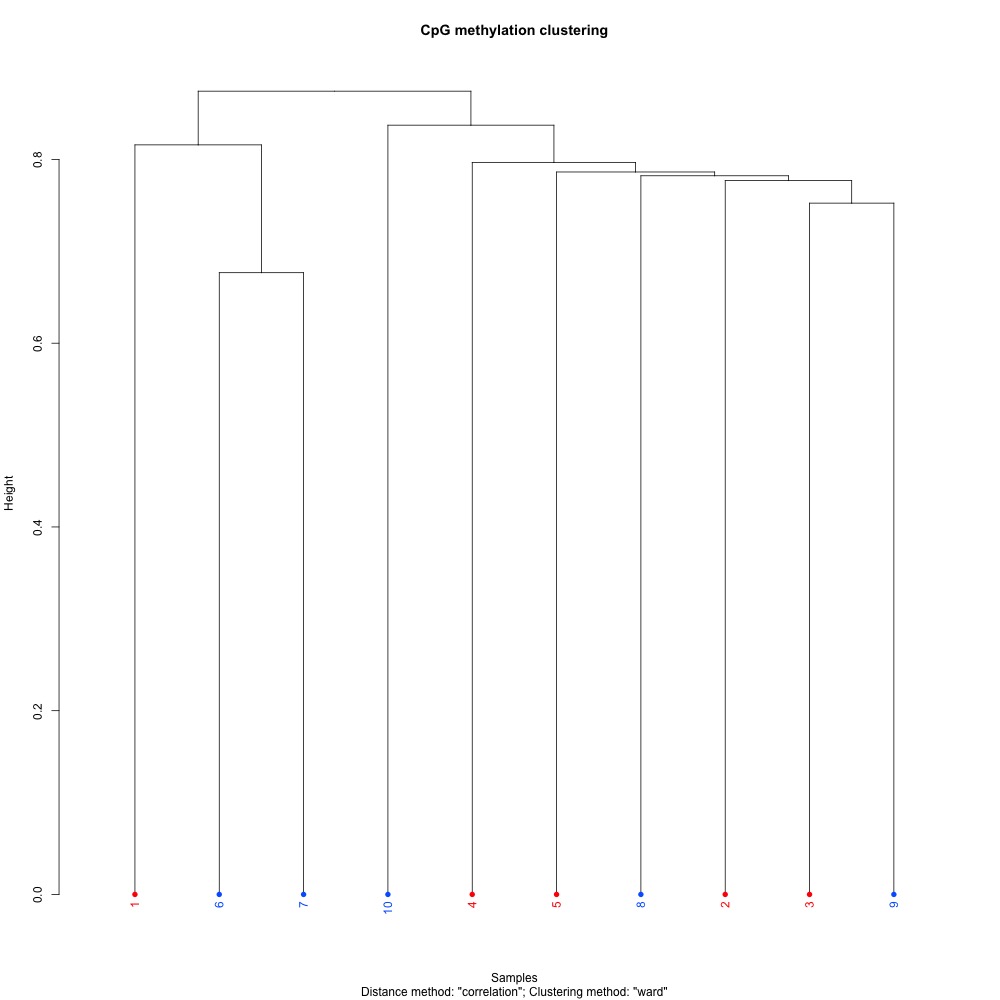
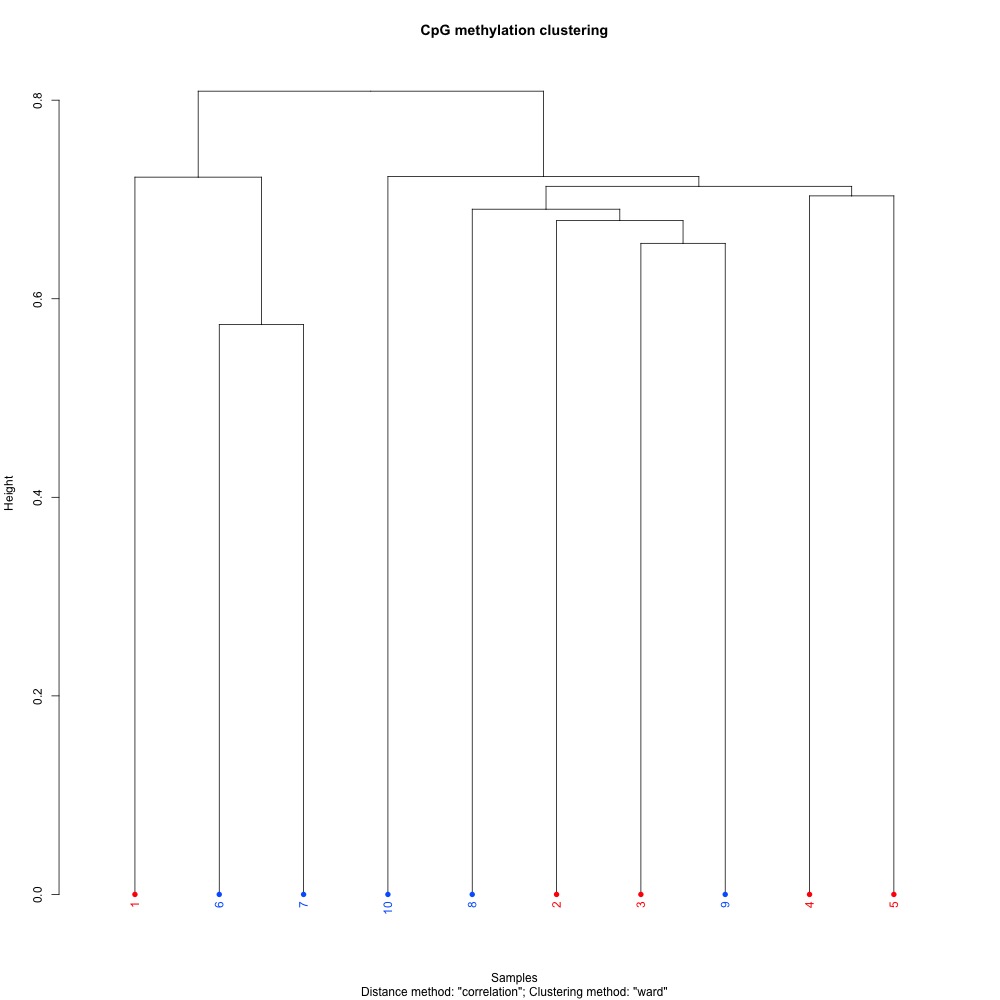

Figures 7-9. Full sample CpG methylation clustering using a) mincov = 1 b) mincov = 3 or c) mincov = 5.
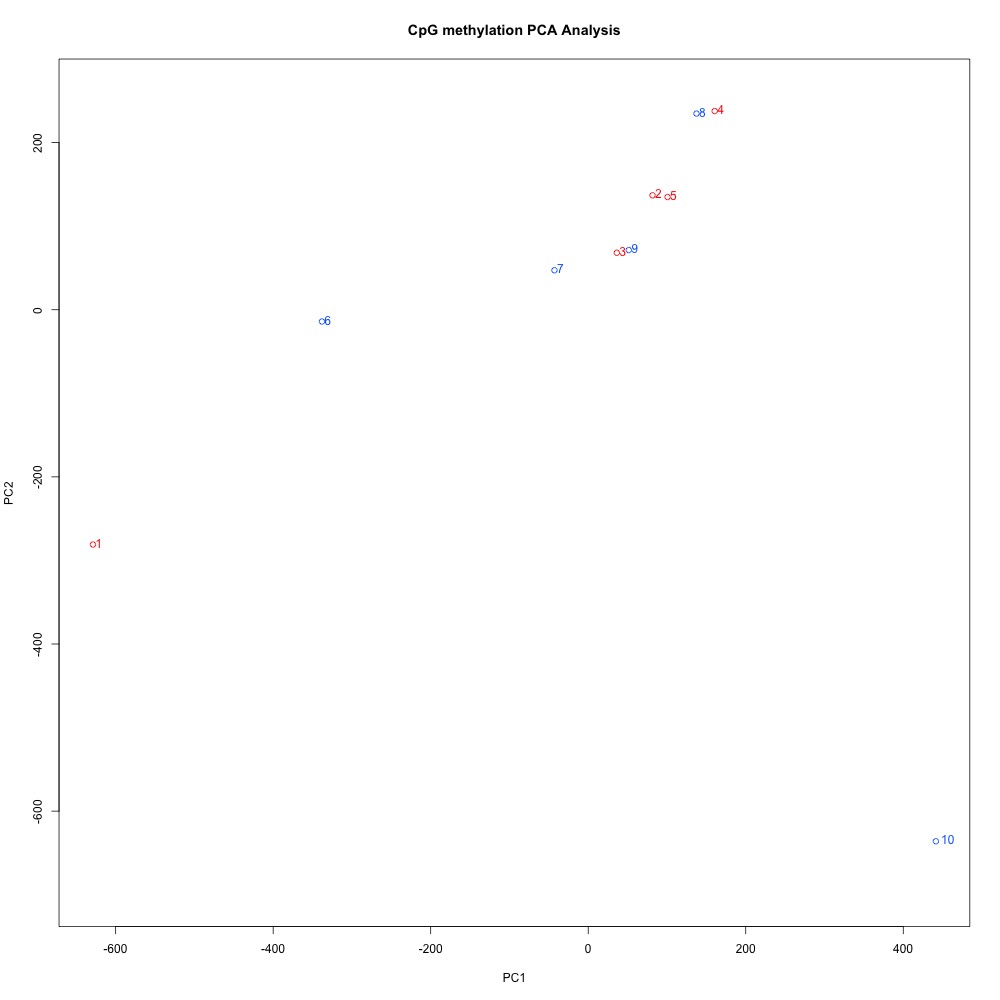
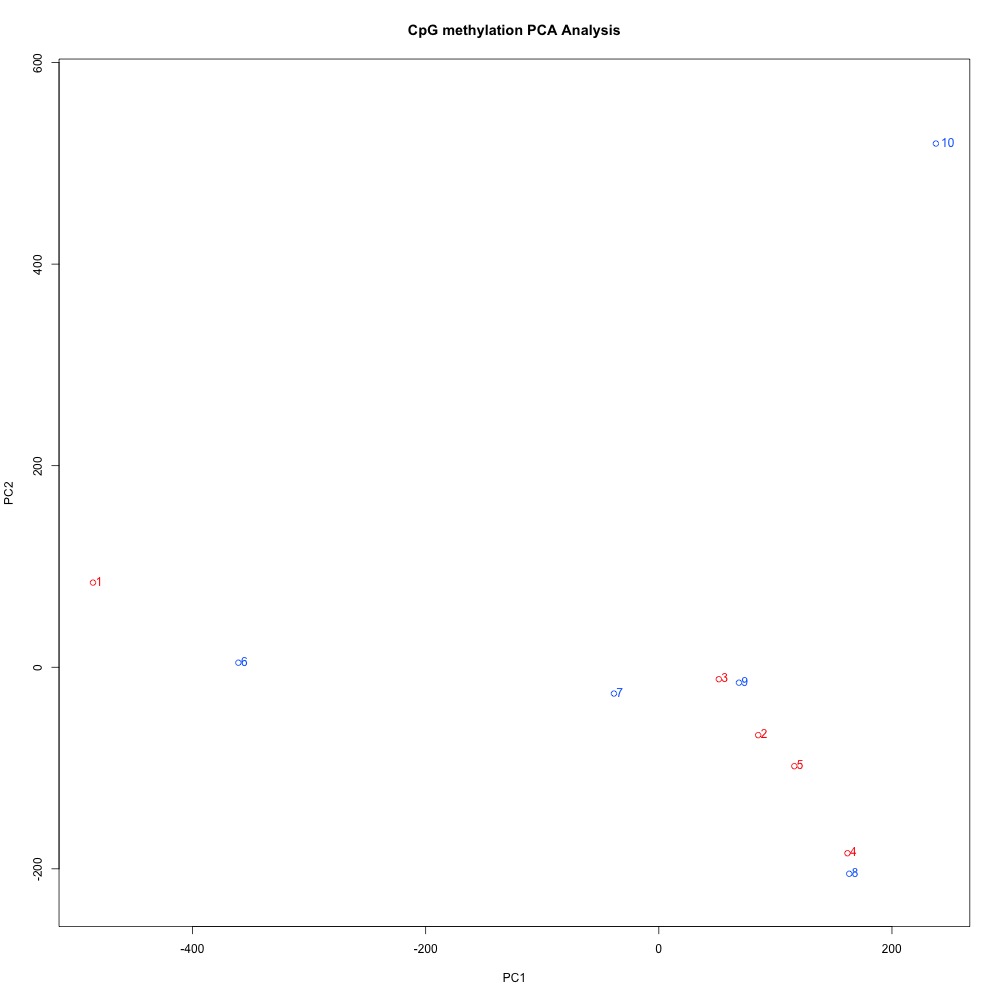

Figures 10-12 PCA of full sample methylation using a) mincov = 1 b) mincov = 3 or c) mincov = 5.
Table 2. The mincov metric, total number of loci produced, and the number of DMLs that were at least 50% different between treatment andc control samples. More restrictive mincov metrics produced less significantly different DMLs.
mincov |
Total Loci | Number of Significantly Different DMLs |
|---|---|---|
| 1 | 1112085 | 4904 |
| 3 | 670301 | 1398 |
| 5 | 503780 | 816 |
Look familiar…? That’s because it’s all the same as Steven’s samples! It’s good to know that different users going through the same pipeline get the same results (#ReproducibilityWin).
Going forward
Based on the dendograms and PCA, I think mincov = 3 maximizes clustering of our treatment samples. The more similar those treatment samples are, the easier it is for me to create meaning out of our differential methylation data.