
DML Analysis Part 34
Even more troubleshooting with IGV
Gene background issues
Before I could proceed with a gene enrichment, I needed to sort through my gene background issues. The gene background consists of all loci with 5x coverage in my dataset. Previously, my gene background was “hot flaming garbage” when I looked at it in IGV. Assuming that the gene background was working correctly in methylKit, I returned to my R Markdown file to see if the gene background issues were a result of the way I exported the file.
Looking at the gene background, I noticed that there were columns with coverage metrics, as well as the number of cytosines and thymines at each locus. The start and stop position for each locus was the same, which could be affecting how the visualization occurs in IGV.
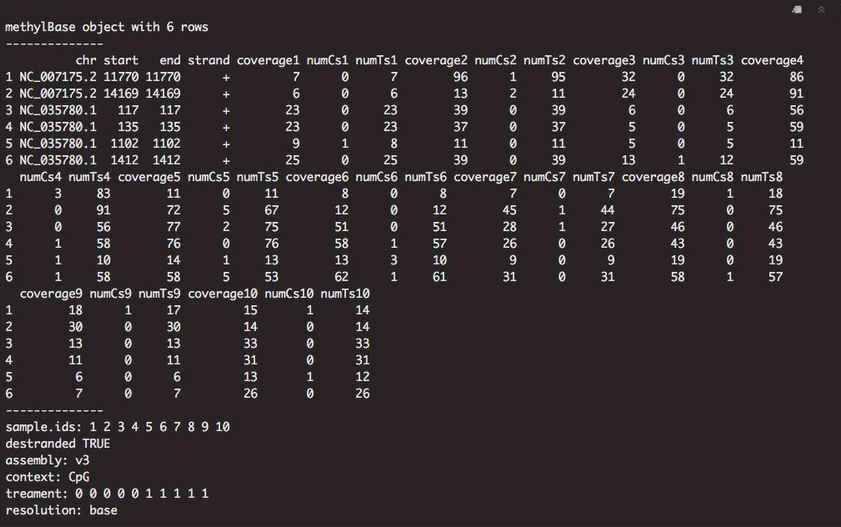
Figure 1. Gene background information in methylKit.
I decided to subset the first four columns for exporting: chromosome (chr), start position (start), stop position (stop), and strand (strand). I did this by creating a new dataframe. I also subtracted 1 from each start position to visualize the data. Finally, I exported the gene background as a BEDfile and looked at it in IGV.
methylationInformationFilteredCov5DestrandReduced <- data.frame("chr" = methylationInformationFilteredCov5Destrand$chr,
                                                                "start" = methylationInformationFilteredCov5Destrand$start,
                                                                "stop" = methylationInformationFilteredCov5Destrand$end,
                                                                "strand" = methylationInformationFilteredCov5Destrand$strand) #Subset data
methylationInformationFilteredCov5DestrandReduced$start <- (methylationInformationFilteredCov5DestrandReduced$start - 1) #Subtract 1 from the start position for visualization
write_delim(methylationInformationFilteredCov5DestrandReduced, "2019-05-14-Methylation-Information-Filtered-Destrand-Cov5.bed", delim = "\t", col_names = FALSE) #Write out all methylation information as a background to be used for gene enrichment analyses.
I opened this IGV session, which had my previous gene background file in it. I added the new file and compared the two versions:


Figures 2-4. Gene background visualization in IGV.
Looking at different sections, I found that the gene background aligned with CG motifs and various DML instead of looking like large regions of information! I feel confident with this new version of the gene background and think I could use it for gene enrichment.
Difference between gene and mRNA tracks
During lab meeting, I pointed out that there were coding sequences included in genes that were not part of the mRNA track. These coding sequences had defined exons. Kaitlyn pointed out that the exons are the elements retained in mRNA, but the exons in coding sequence (CDS) are the parts that get translated. That clears up the question I posed in this issue.
Refining the intron track
Based on this information, I decided to use subtractBed with the gene ane exon tracks to create my intron track. When I looked through that track in IGV, I found that there were some areas where the intron track looked good. Introns from coding sequences were included (unlike the one I generated using mRNA), and the first bp in every exon sequence was no longer being included in the intron track.

Figure 5 Example of introns generated from the gene and exon tracks that are not included in the intron track I generated from mRNA or the intron track I downloaded from the Genomic Resources wiki.
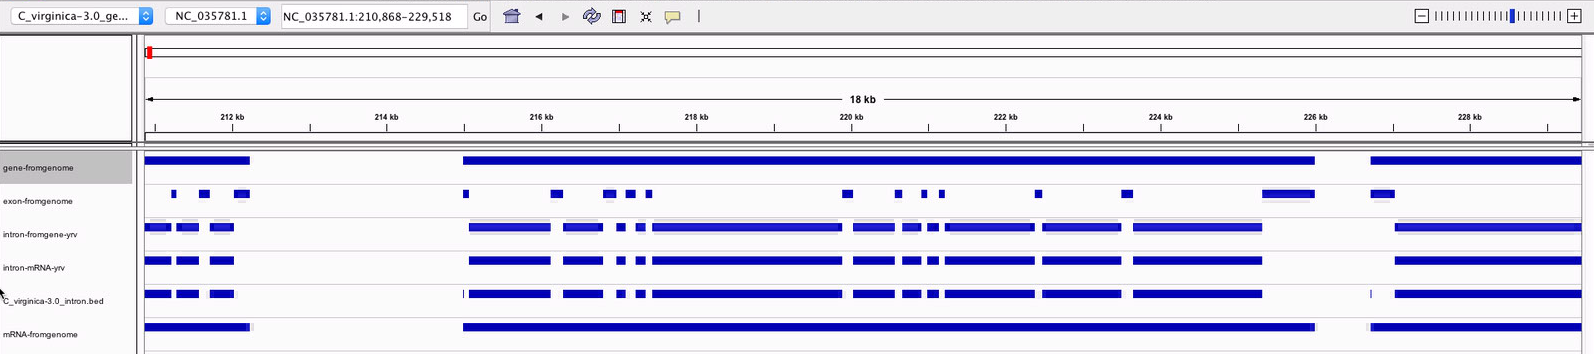

Figure 6-7. Instances were the intron track from the Genomic Resources wiki includes the first bp of each exon, but the intron track I generated does not.
However, there were instances of the intron track I generated still including exons:


Figures 8-9. Areas where the intron track still contained exons.
I posted my findings in this comment and asked if it was an artifact of enforcing same strandedness with -s, or if it was worth using subtractBed on the intron and exon tracks to get rid of the overlaps. Since exons and introns are on the same strand, I don’t think -s is the issue, but perhaps there’s a different way I need to code it.
Hypermethylated vs. hypomethylated DML
One thing I’ve been meaning to do for a while is characterize location differences between hypermethylated and hypomethylated DML. While I did just generate genome feature tracks myself, I decided to use the pre-made tracks I downloaded to complete this analysis so I know the code works. I can always revise the paths to the tracks later once my tracks are finalized.
Characterizing locations of hypermethylated and hypomethylated DML
I returned to this Jupyter notebook to use intersectBed and get locations of hypermethylated and hypomethylated DML. There are 310 hypermethylated and 288 hypomethylated DML. I was curious if one type of DML would be more dominant in exons or introns. The only pattern that jumped out to me was the difference in hypermethylated vs. hypomethylated DML in putative promoter regions (44+/23-).
Table 1. Genomic locations of hypermethylated and hypomethylated DML
| Genomic Feature | Hypermethylated | Hypomethylated |
| :———————————————: | :—————————: | :—————————: |
| Unique mRNA | 761 | 792 |
| Exons | 190 | 178 |
| Introns | 99 | 92 |
| Transposable Elements (All) | 26 | 31 |
| Putative Promoters | 44 | 23 |
| Other | 13 | 7 |
Going forward
- Finalize the intron track
- Conduct a gene enrichment for DML
- Figure out what’s going on with DMR
- Work through gene-level analysis
- Update paper repository
- Update methods and results
- Start writing the discussion