
Gigas Broodstock DNA Extraction Part 7
Extraction plan for actual samples
But first…
Bioanalyzer results
Kaitlyn ran DNA samples from protocol test 3 and test 4 on the Bioanalyzer. To see the results, I used the 2100 Expert software on the Windows machine. I selected “High Sensitivity DNA” and opened the data files. Each data file has two separate result views: electropherogram and gel. I took screenshots of both formats.
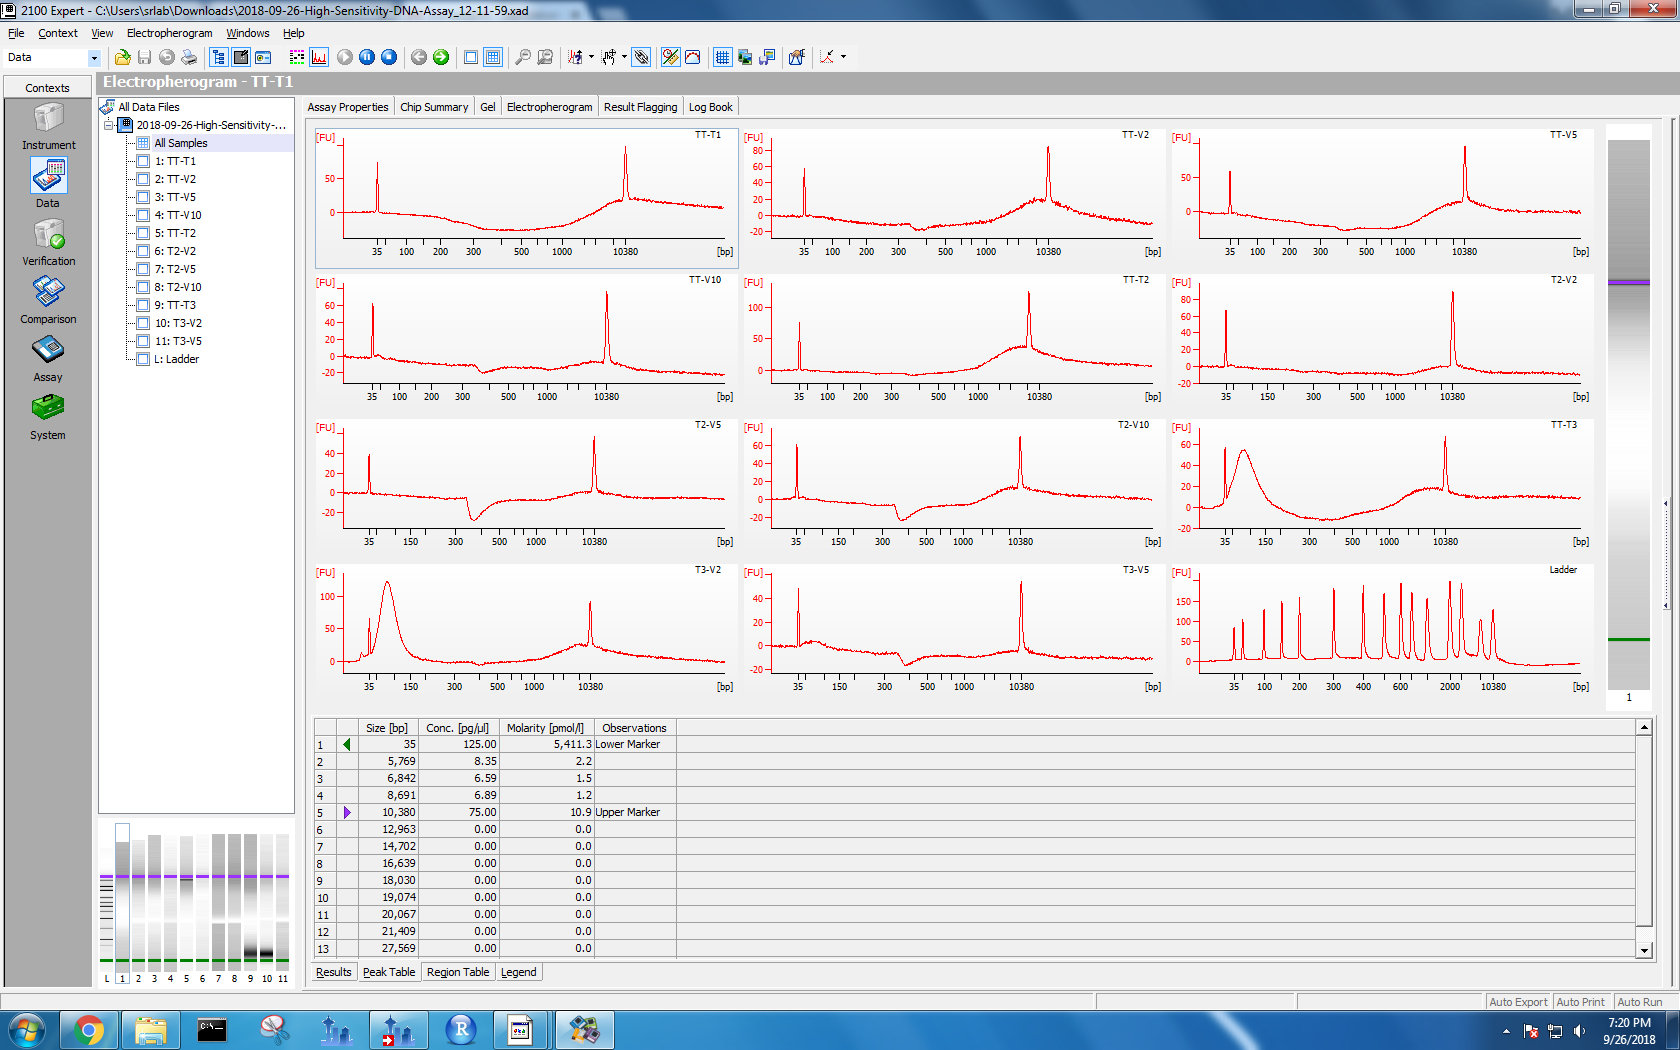
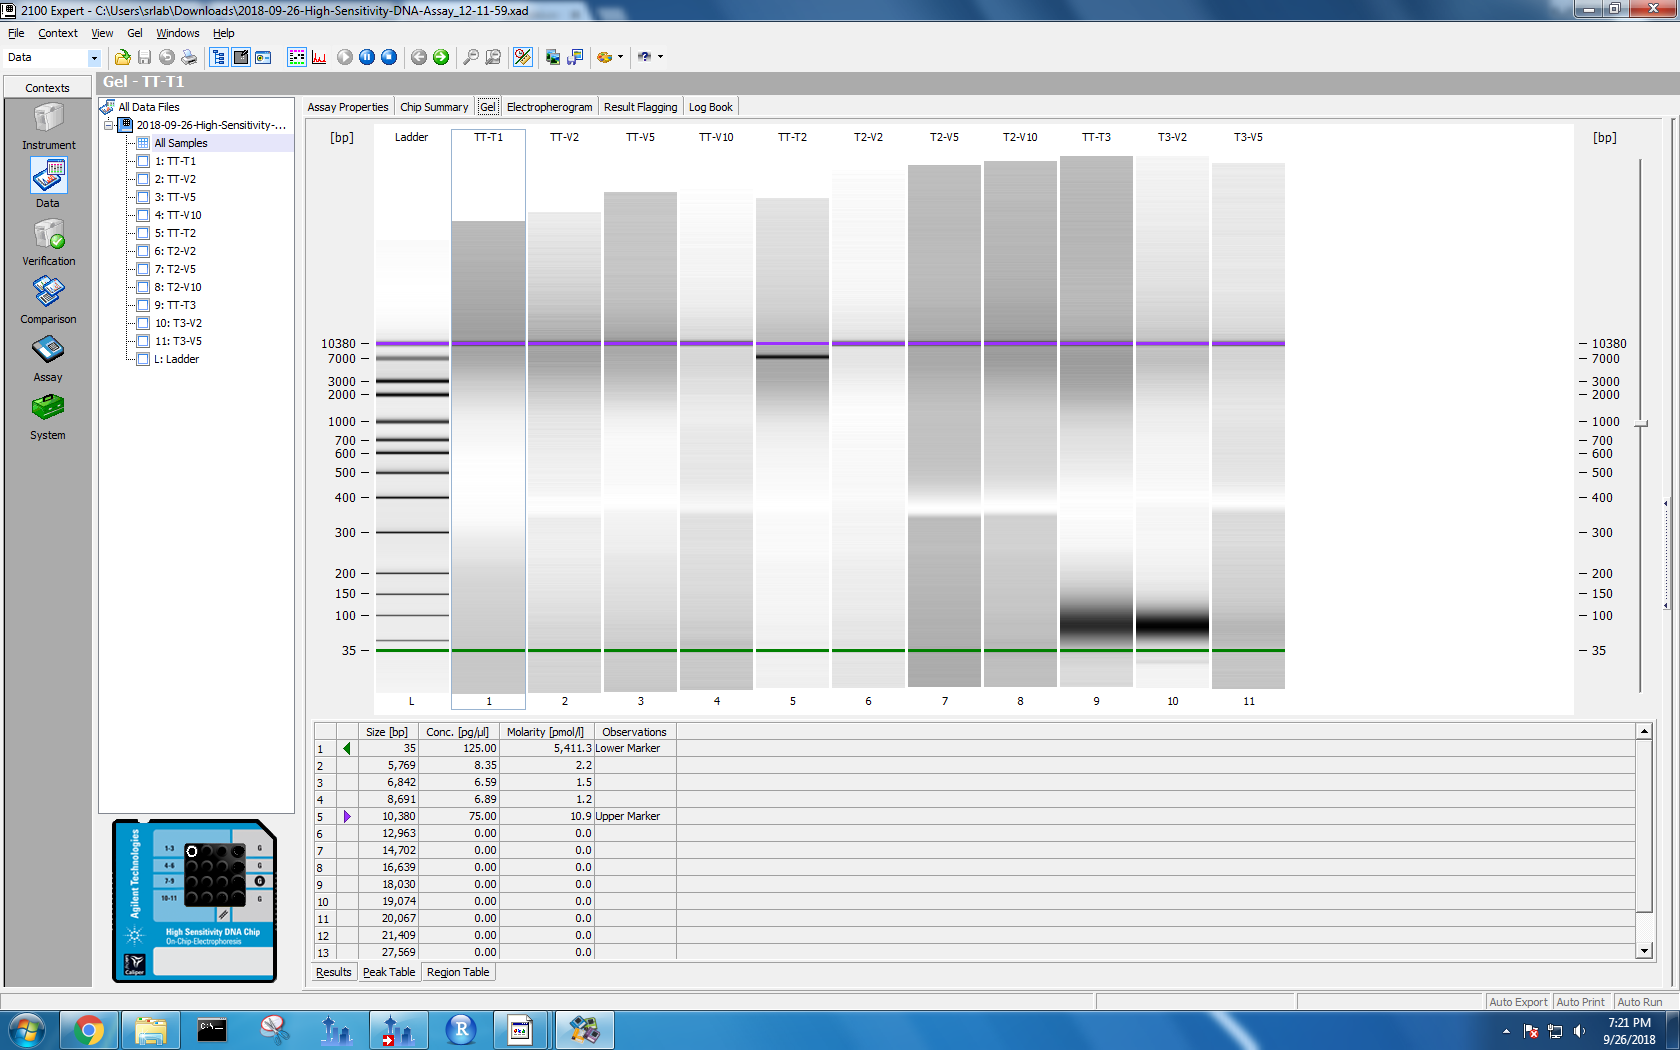
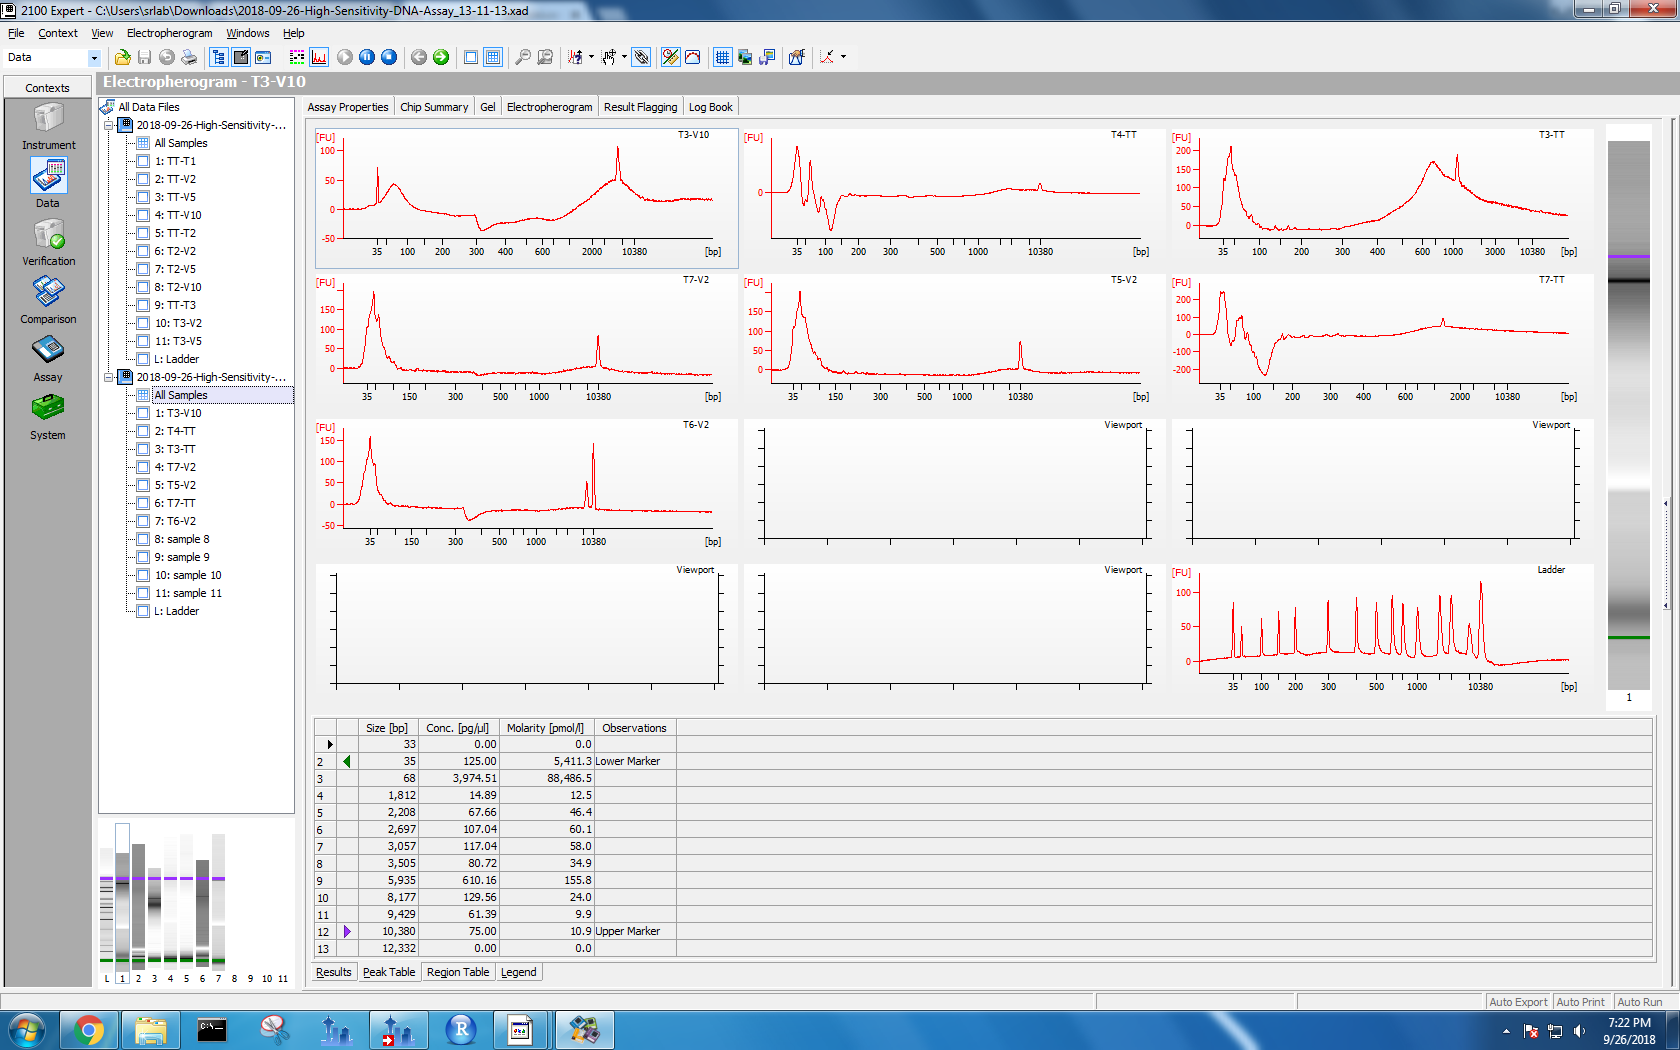
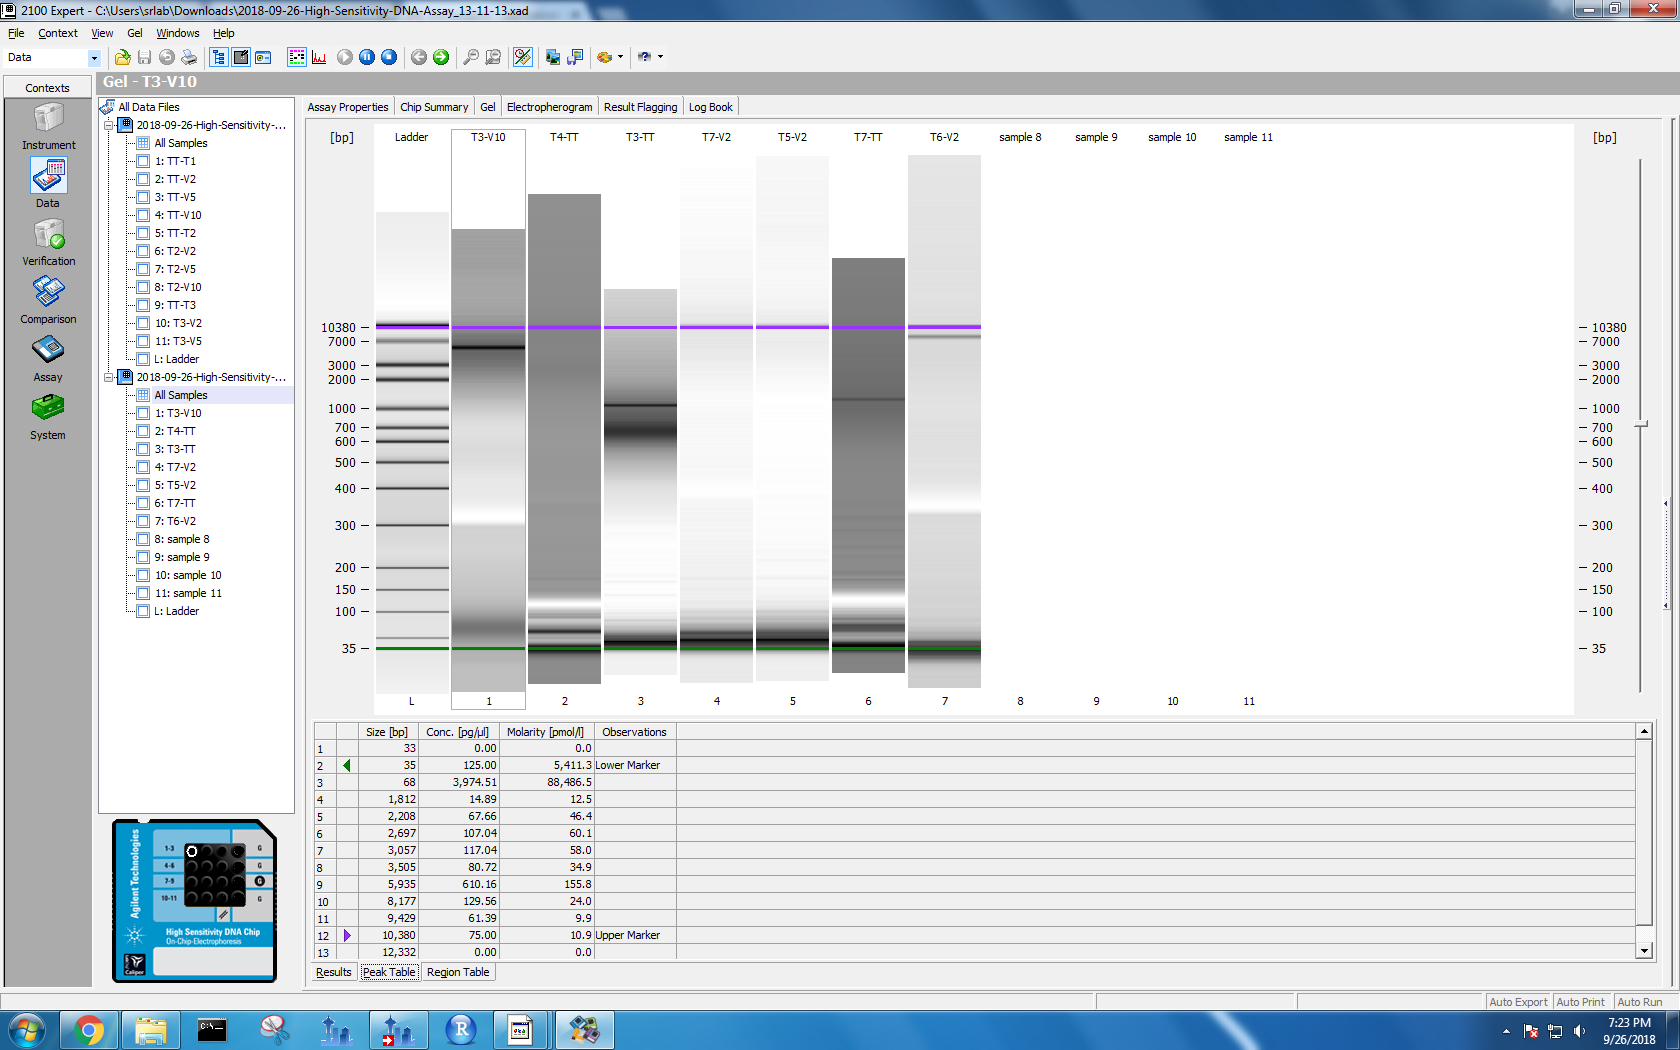
Figure 1-4. Electropherogram and gel results for samples run on Bioanalyzer. Sample names are on the left. The top two photos correspond to the first set of samples, and the bottom two with the second set.
Based on her findings, all of my methods lead to DNA shearing to 35 bp. However, my tissue tearor method samples also have electropherogram peaks at 10,380 bp. I wasn’t sure if I needed a different lysis method or if I was good to go, so I posted this issue.
Extraction protocol
The official protocol can be found here.
I have 10 gonad samples per pH treatment (ambient or low). Because 20 samples is a lot to work with at once, I’ll do 2 days of DNA extractions with 10 samples each. I randomly selected which ambient and low pH samples to extract in each batch. The IDs correspond to names on histology photos in this folder. Below are diagrams for each histology block:
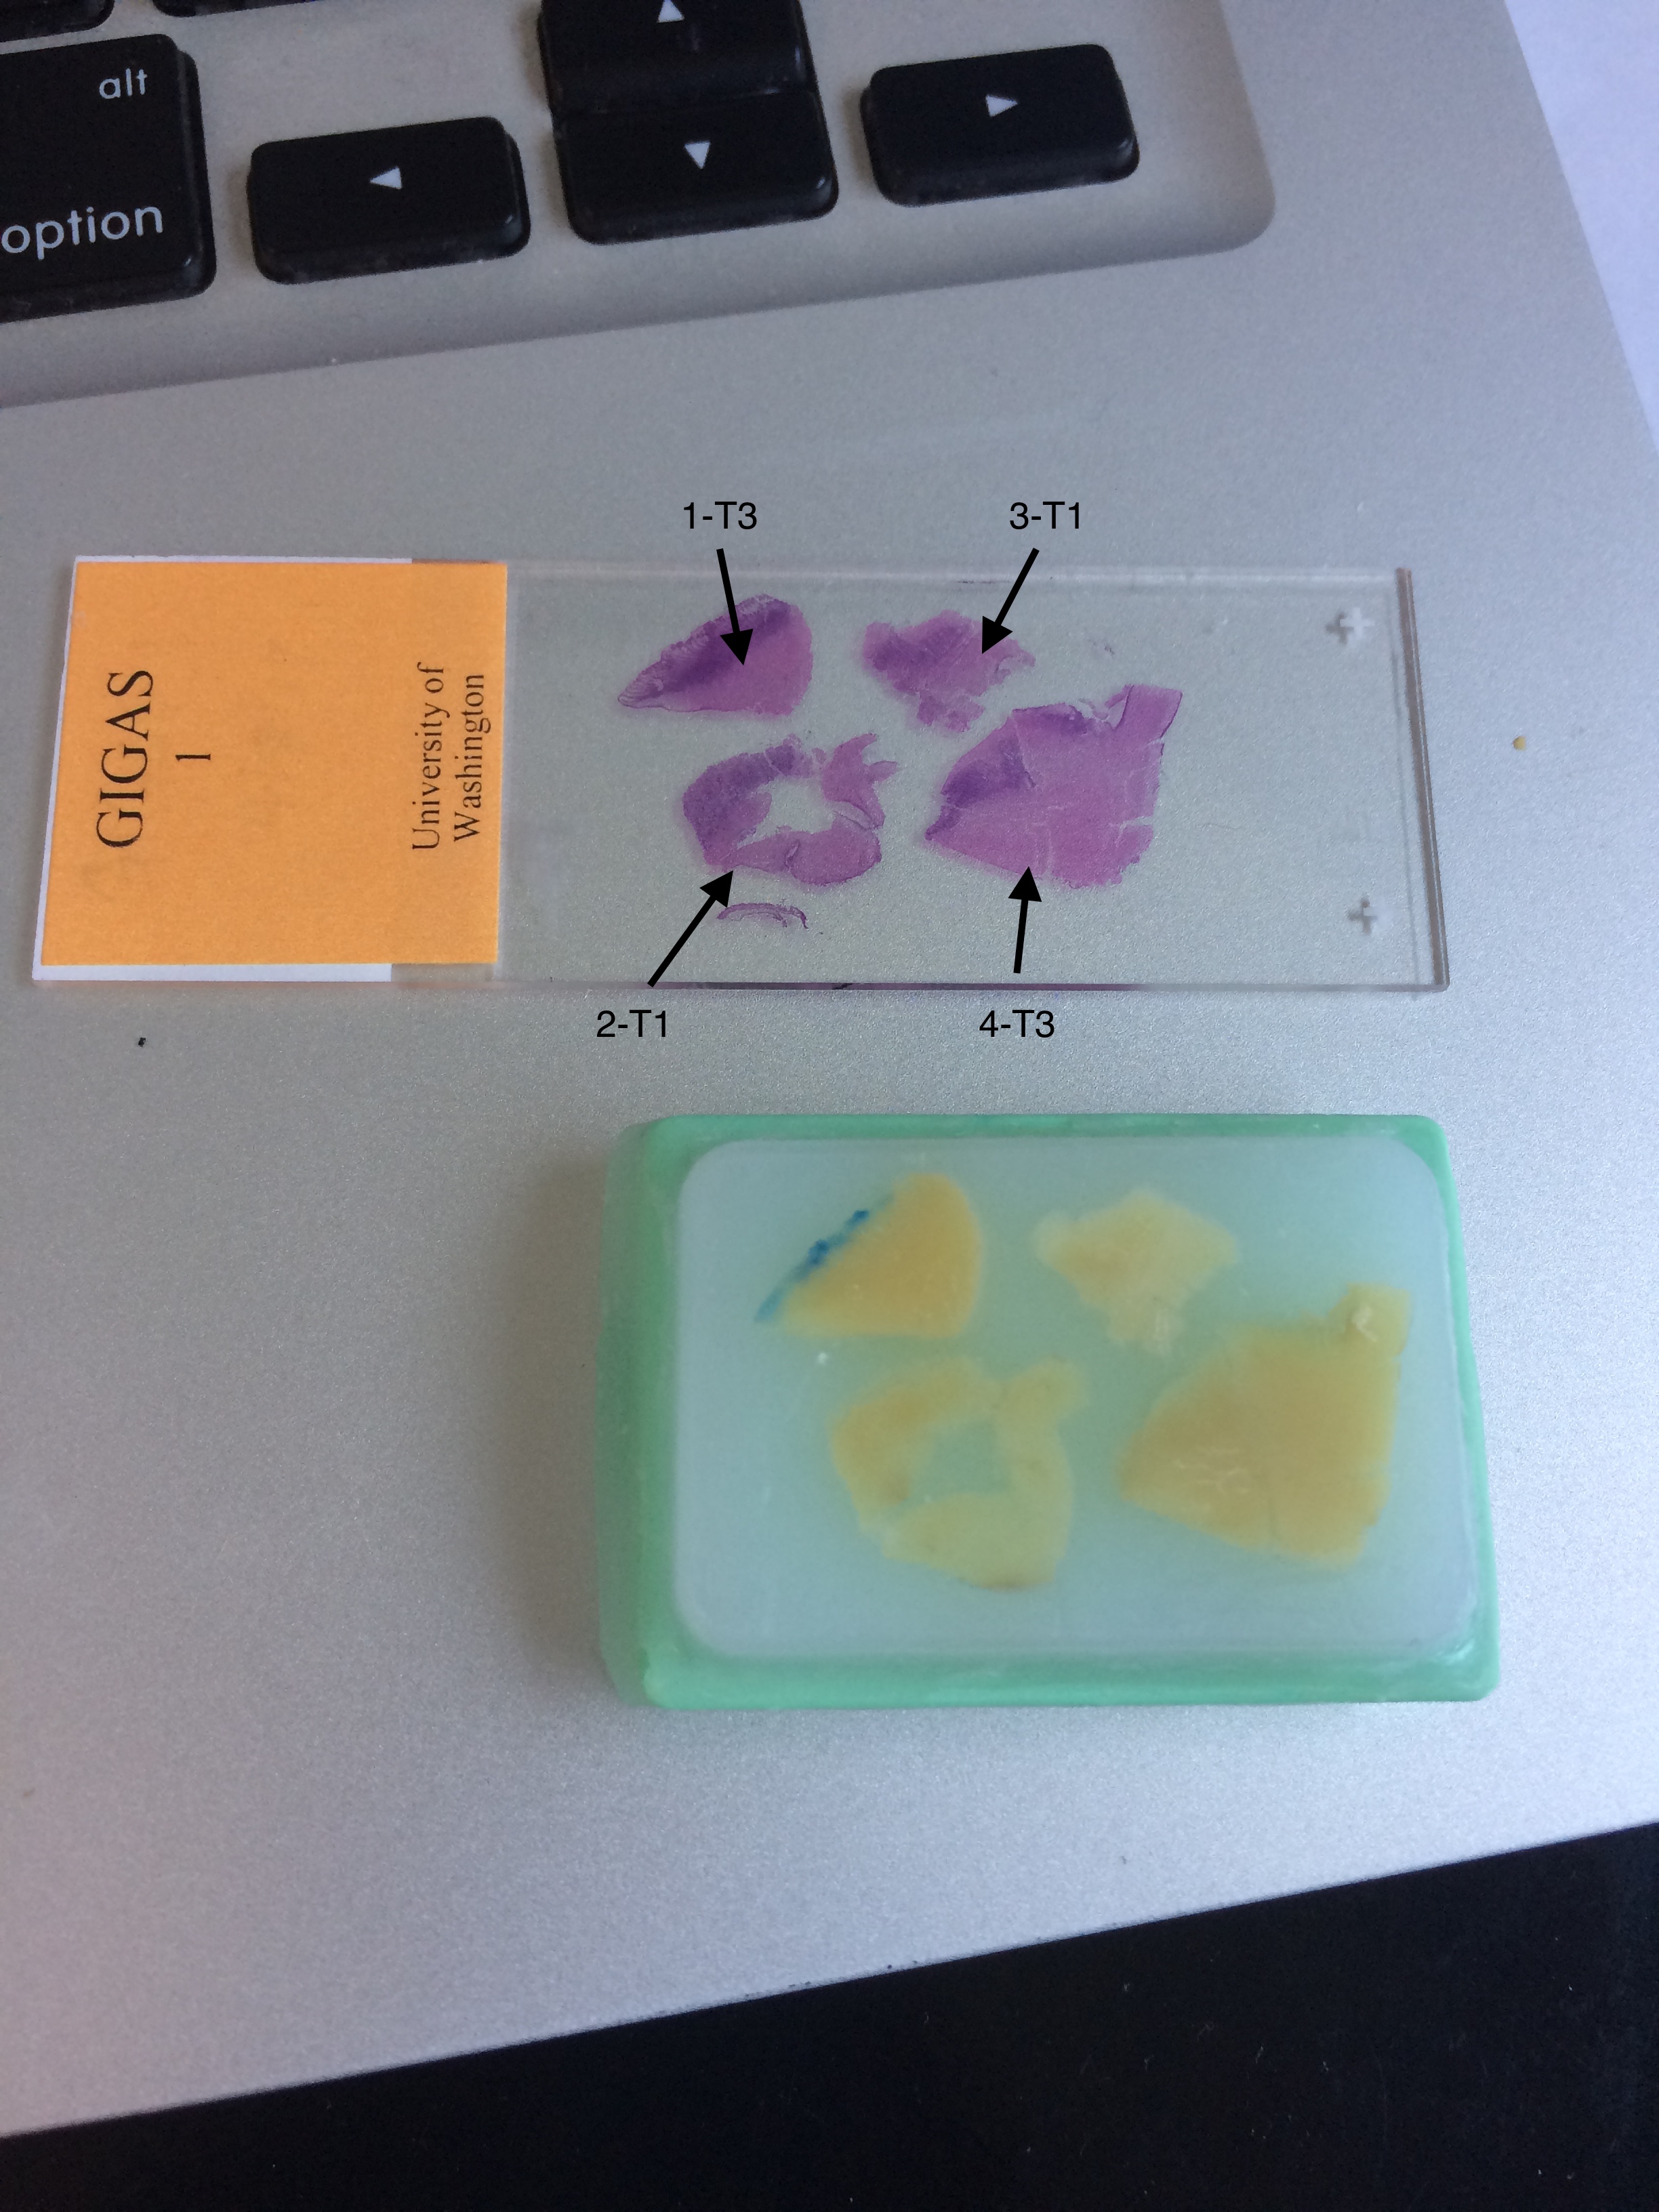
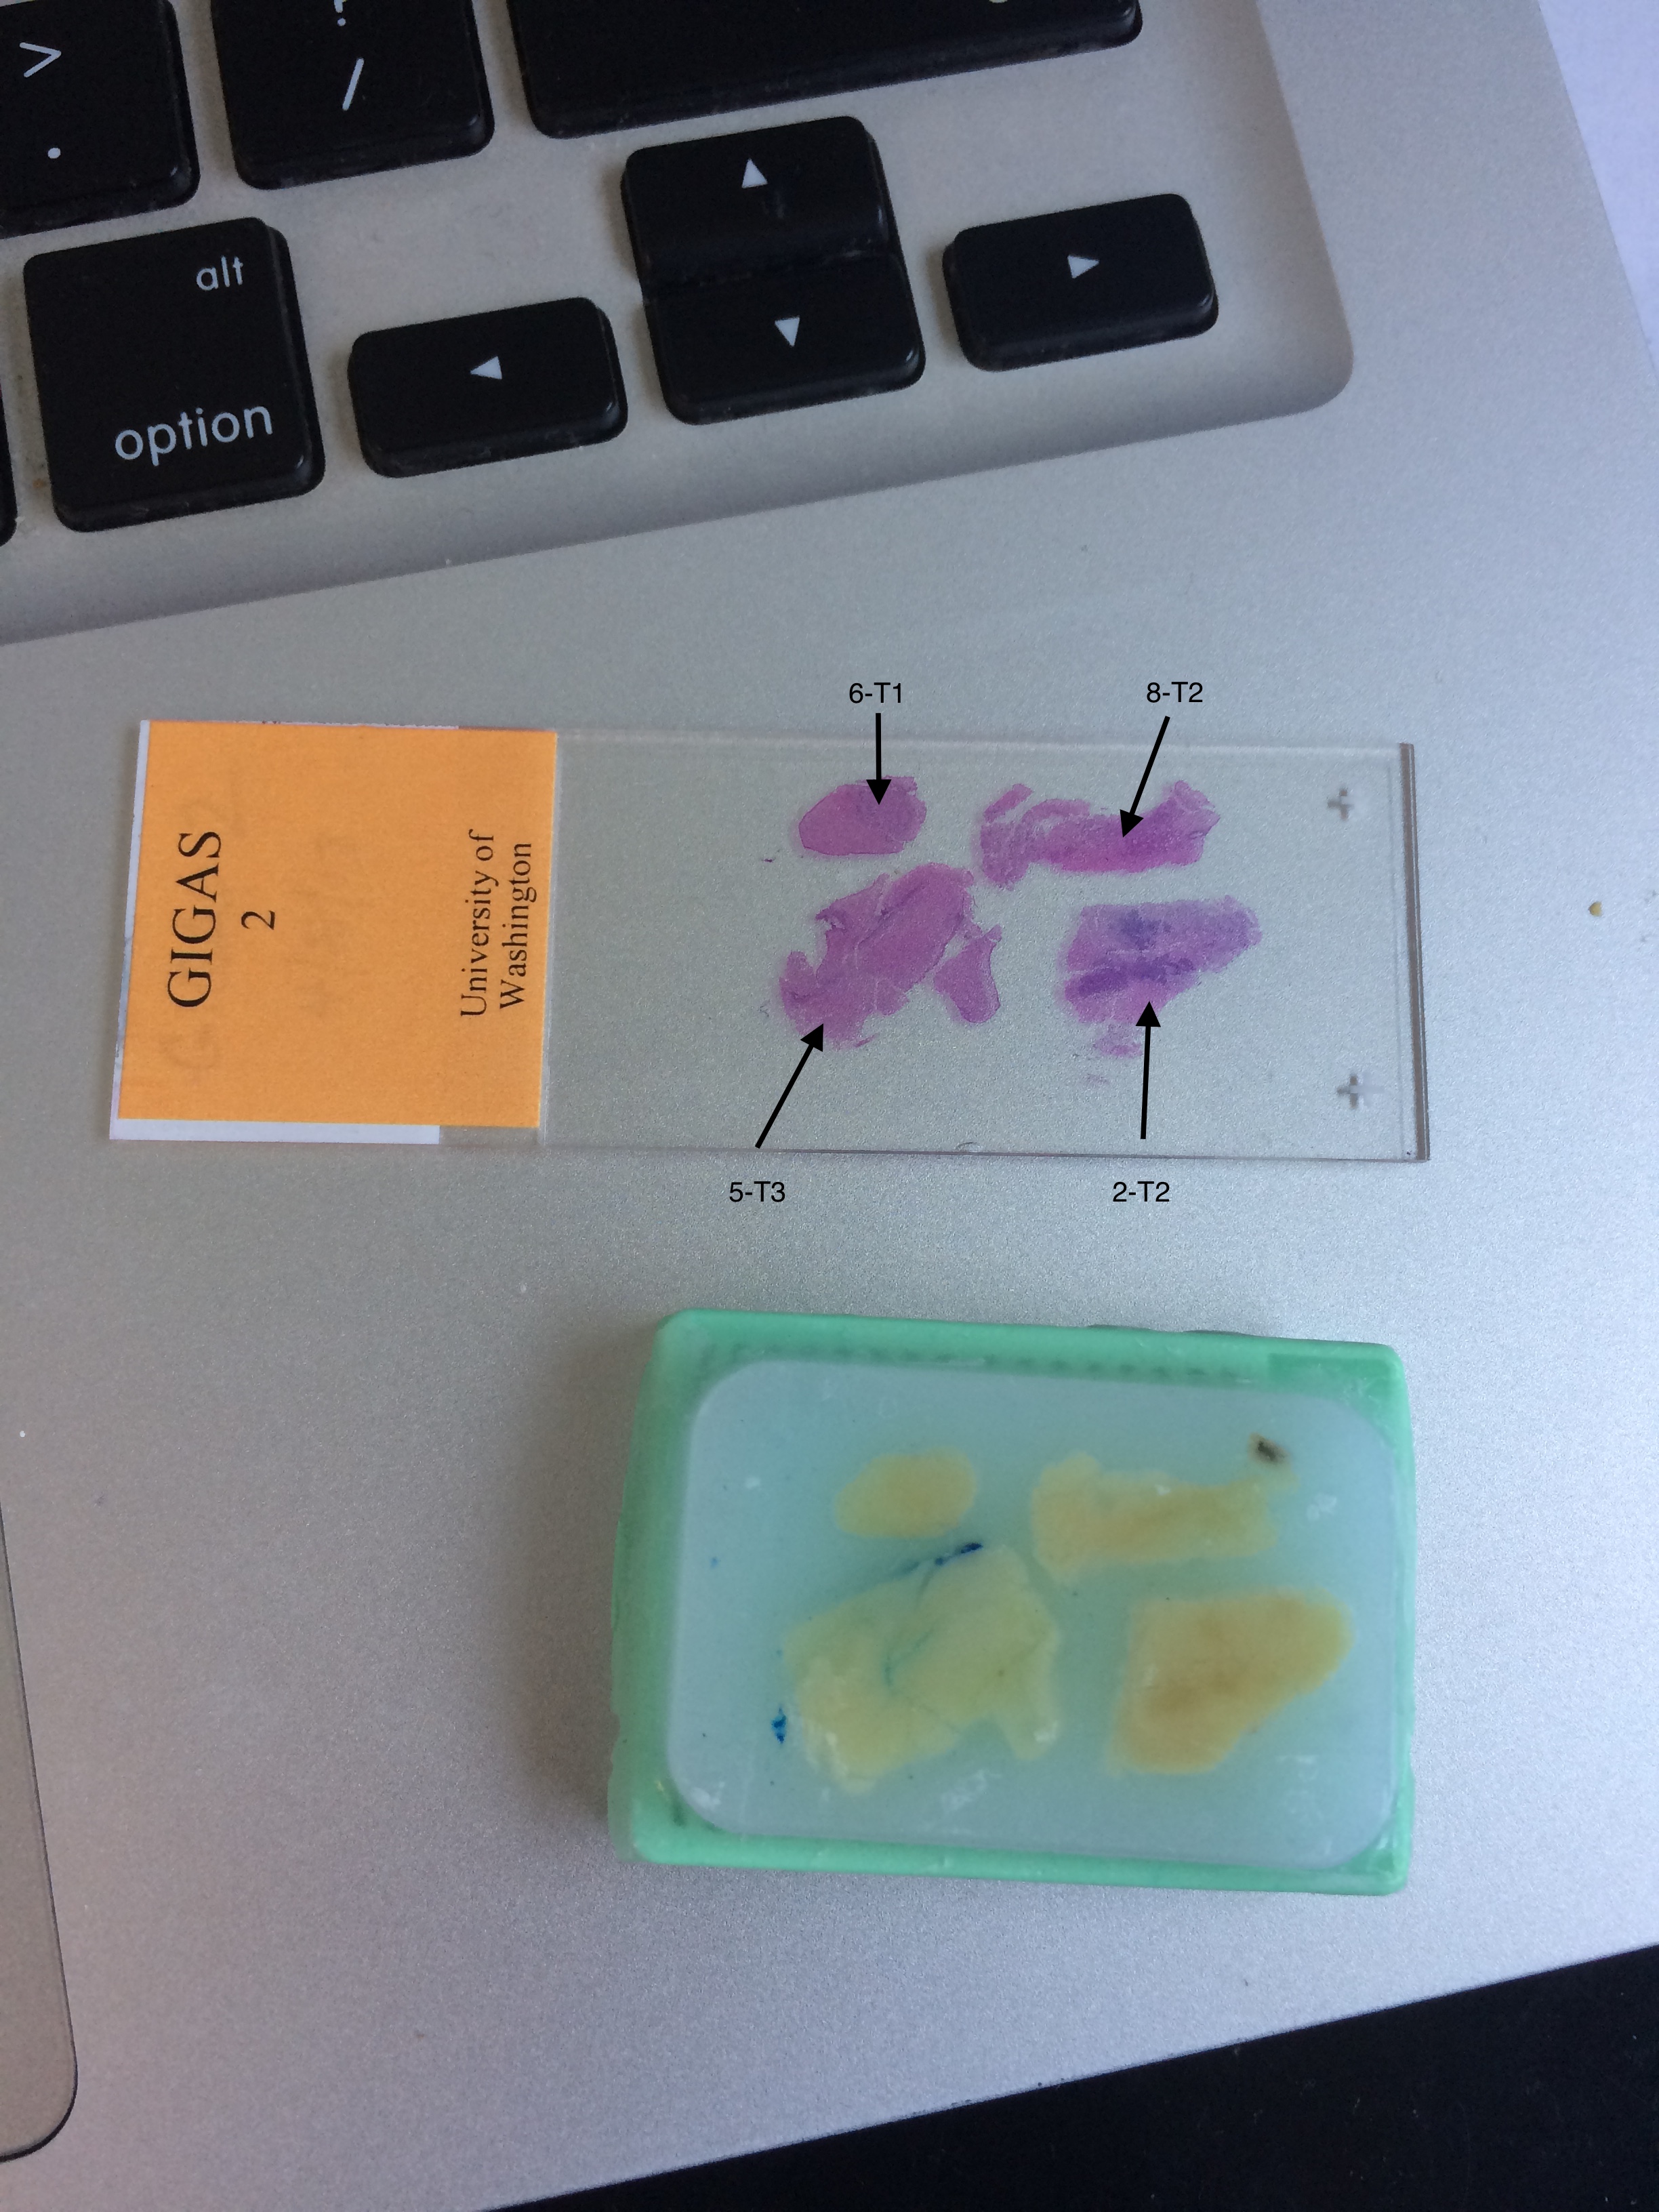
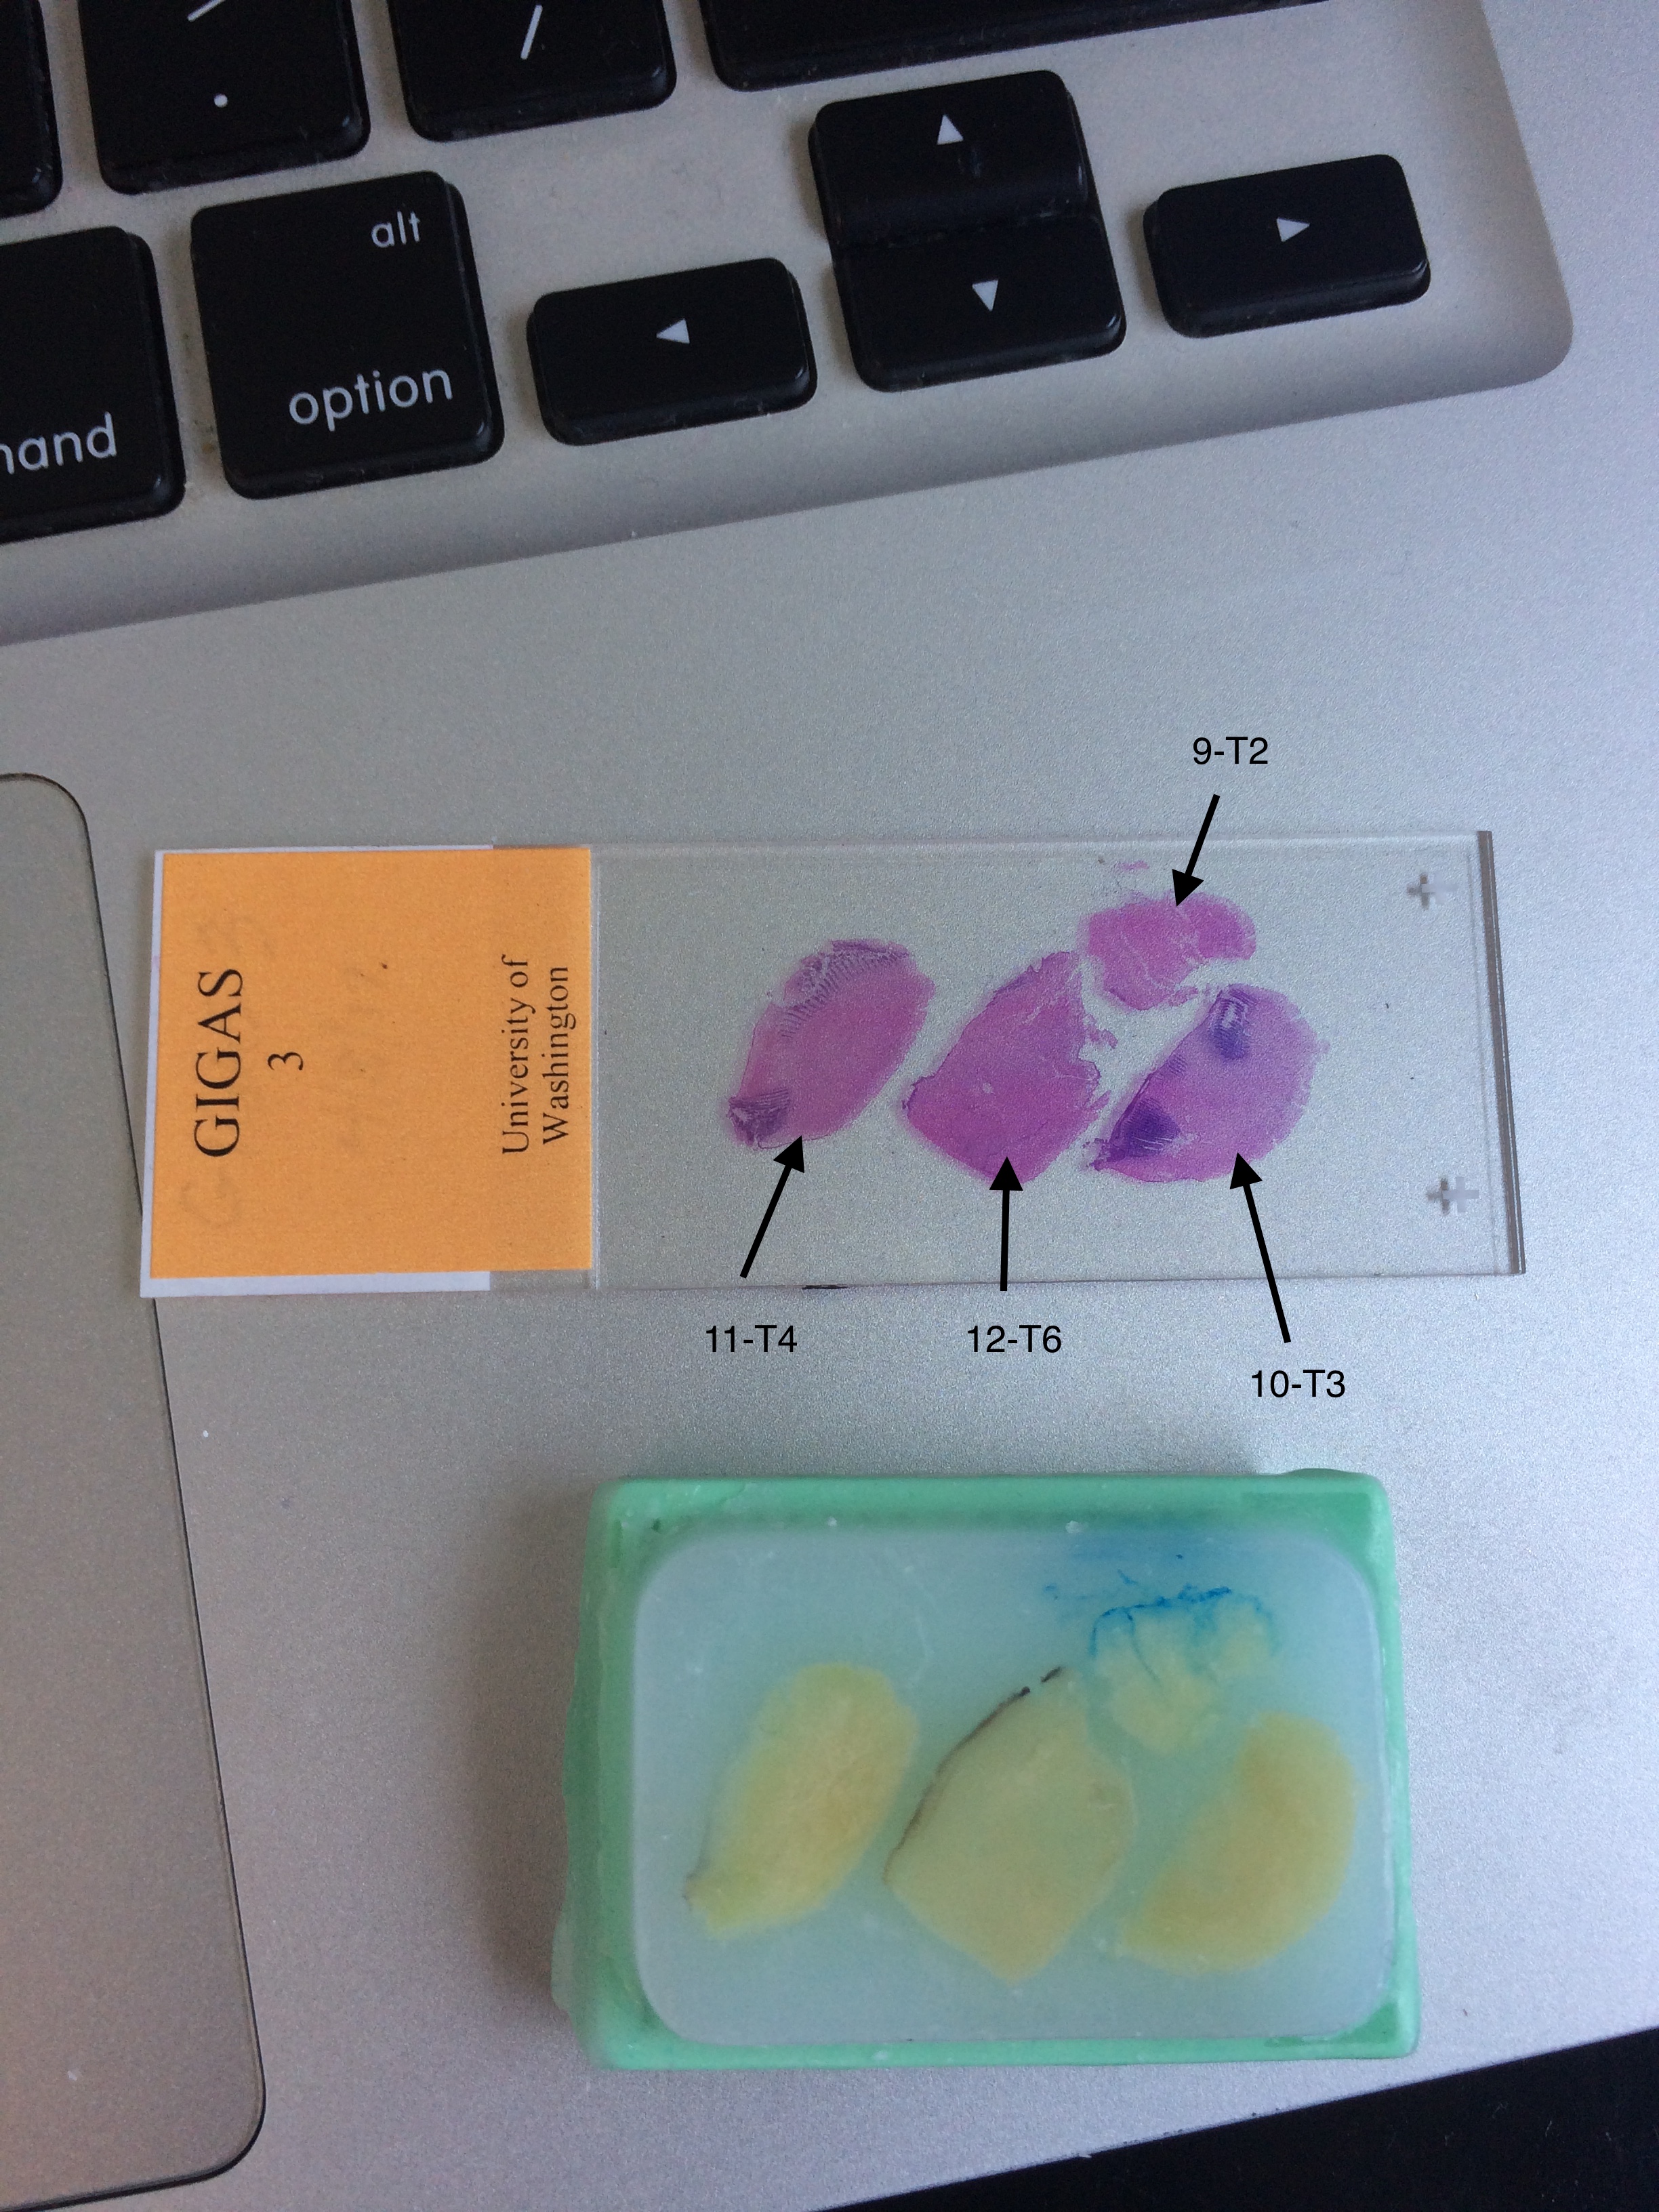
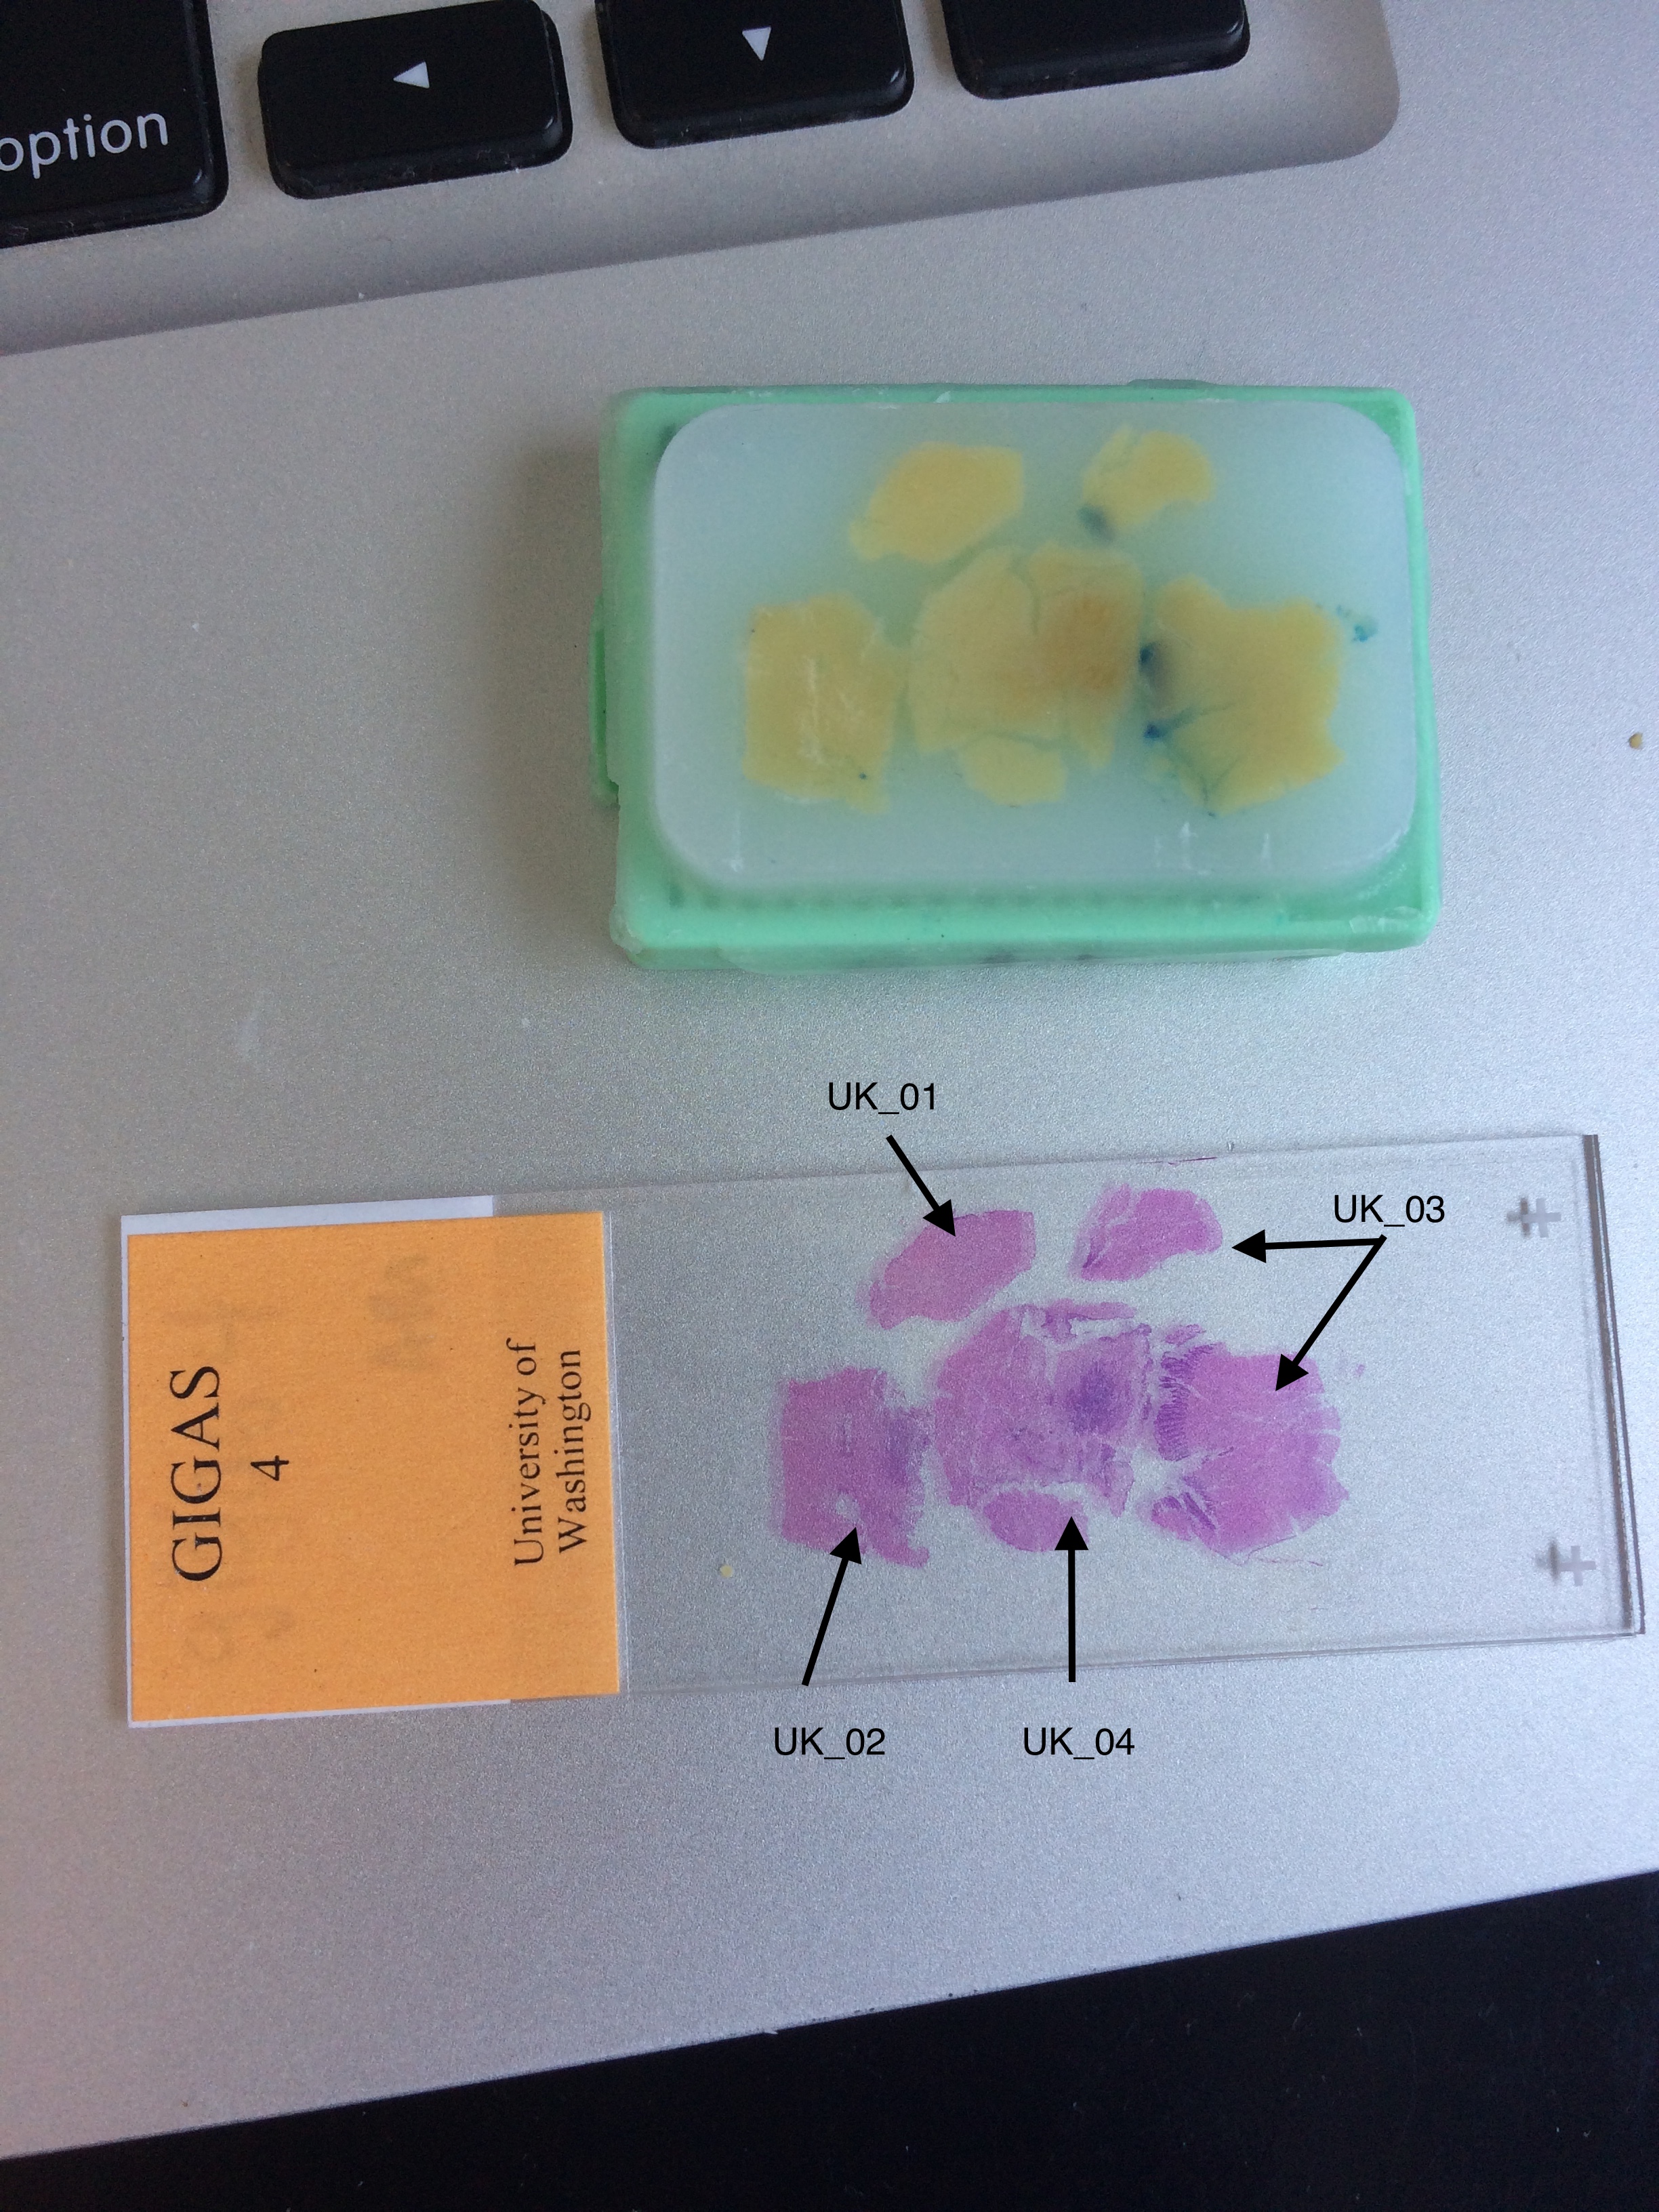
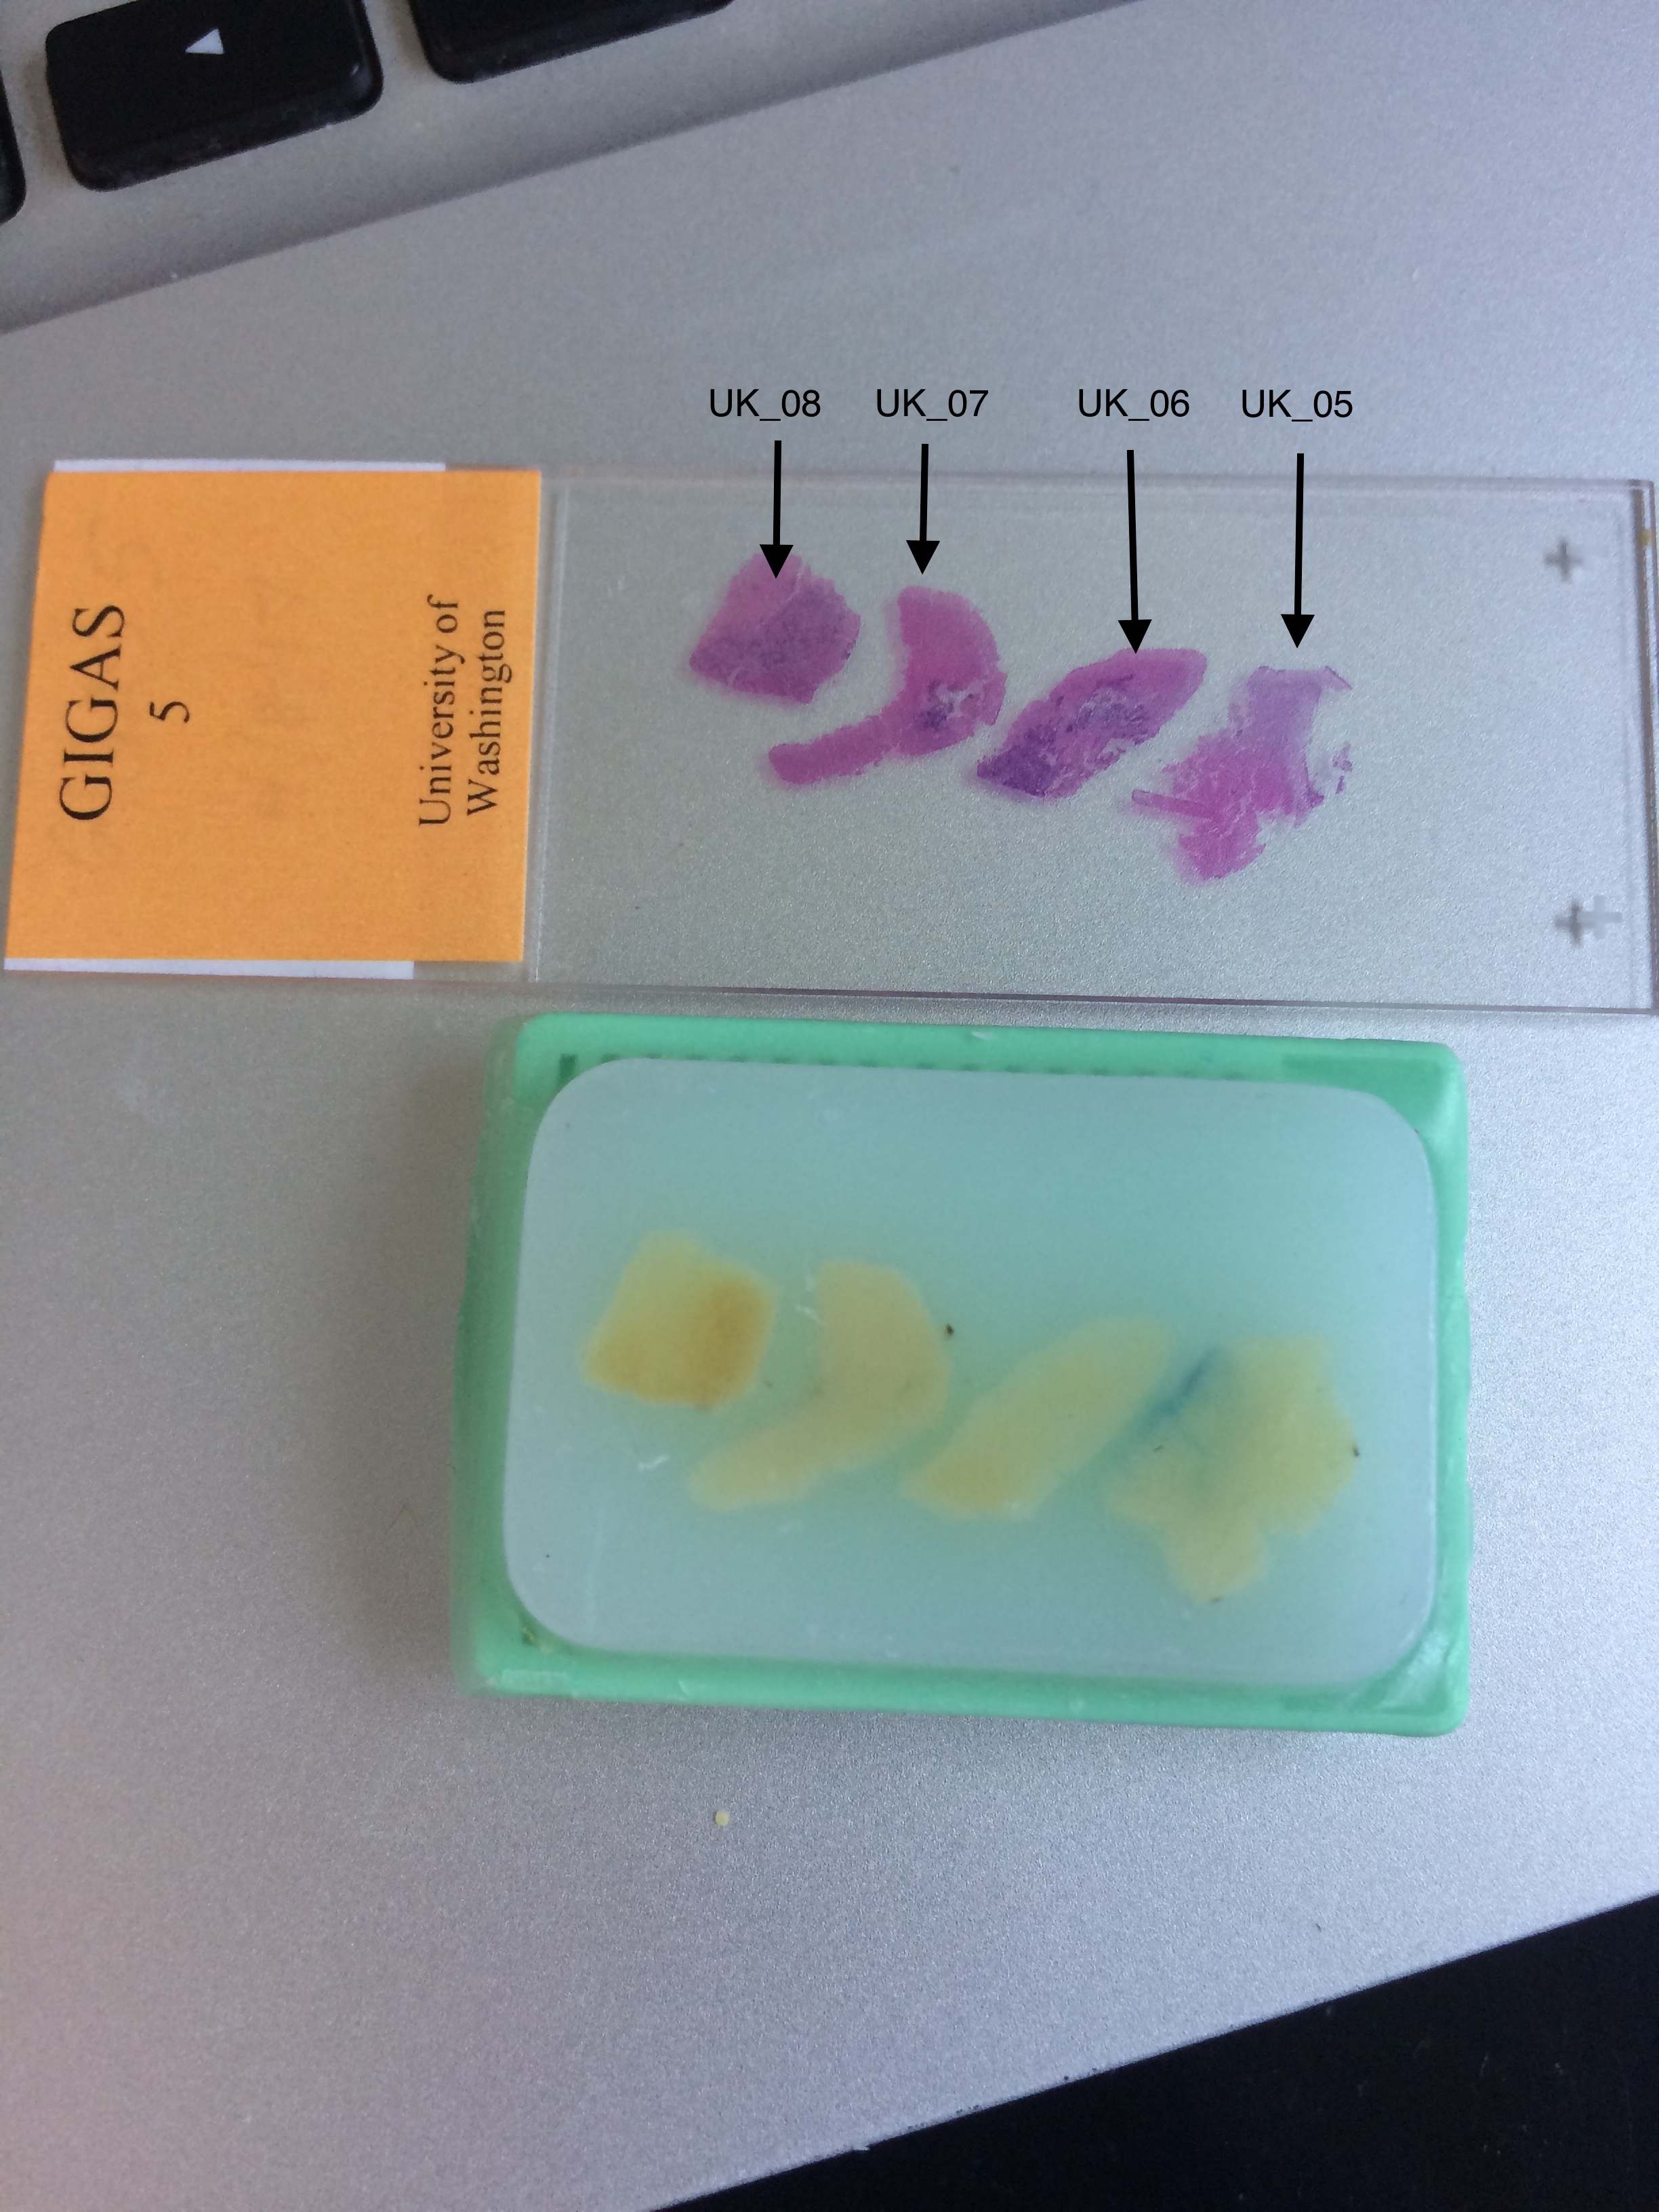
Figures 1-5. Location of each tissue sample on histology blocks.
Batch 1: I’ll extract DNA from this batch tomorrow.
Low pH:
- 6-T1
- 9-T2
- 2-T1
- 5-T3
- 4-T3
Ambient pH:
- UK-07
- 12-T6
- UK-04
- UK-03
- UK-01
Batch 2: I’ll extract DNA from this batch on Tuesday.
Low pH:
- 1-T3
- 7-T2
- 8-T2
- 10-T3
- 3-T1
Ambient pH:
- UK-06
- 11-T4
- UK-05
- UK-08
- UK-02