
Gonad Histology Check-in
Quick journey into Manchester world
Grace has been super busy analyzing my gonad histology data (#trumie)! She hasn’t finished all gonad maturation state or sex classification yet, but here’s a quick peek into what she has so far.
Her classification spreadsheet can be found here. Within this file, she made pie charts to visualize sex ratios before and after pH exposure.
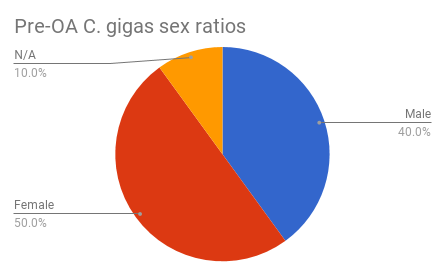
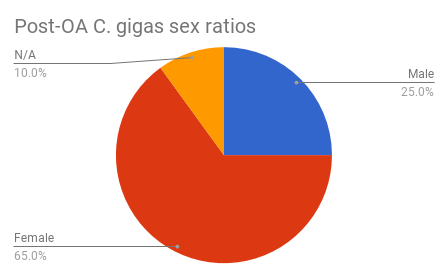
Figures 1-2. Preliminary pre and post-OA sex ratios.
In the same file, I made some pie charts to look at gonad maturation state between treatments. She only has maturation state information for four oysters before exposure, so I made graphs for the post-exposure oysters. When I sampled, I took ten individuals per treatment.
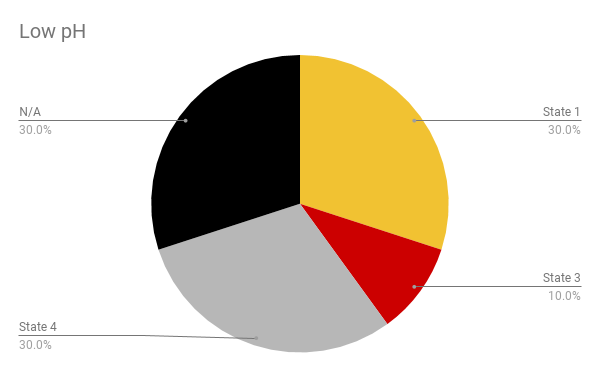
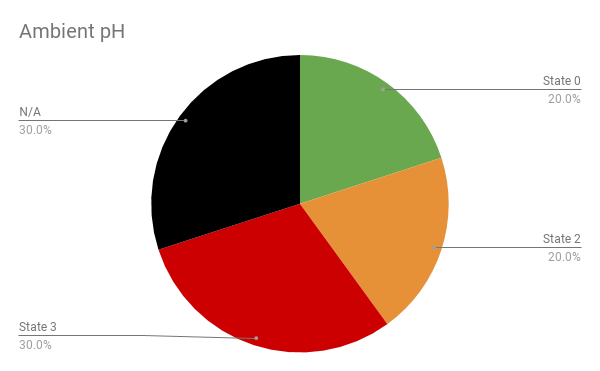
Figures 3-4. Preliminary gonad maturation states, separated by treatment.
For this week’s class assignment, Steven also wanted me to generate a figure for my larval survival data. I think the one I have is sufficient for now…?
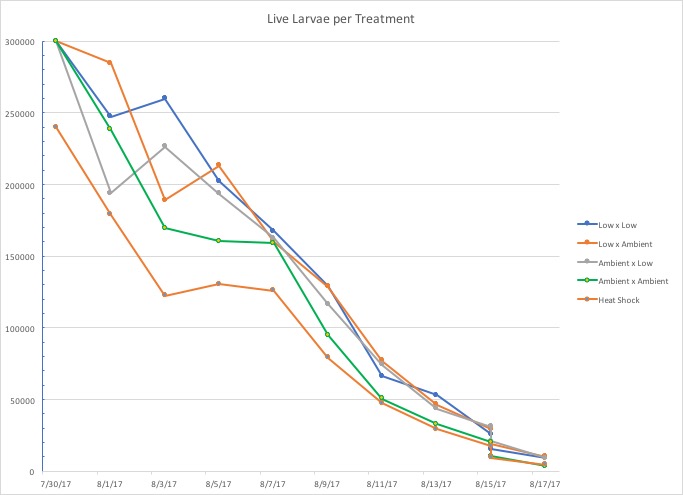
Figure 5. Larval mortality, separated by family.