
Gonad Histology Update
Histology is not an exact science
I picked up where Grace left off with my C. gigas gonad histology analyses. She used Fabioux et al. 2005 to decide whether the specimen was male or female, then some instructions from Enrique-Diaz 2009 to determine maturation stage. Some of them were really difficult to discern! I didn’t have too much trouble differentiating between male and female, but I did have some trouble figuring out if something was Stage 1, 2 or 4. I put question marks next to the classifications I wasn’t too confident with. I think I’ll try and get some help from Brent or Molly, since they’re more experienced with C. gigas gonads.
Here are some examples:

Figure 1. Gigas-1 from pre-exposure sampling. While Grace was looking at this, Brent told her that the red blotches were oocytes. Based off of images in Fabioux et al. 2005, they could be residual oocytes. However, the gametes also look like spermatagonia. It could be a Stage 4 female that’s switching to a Stage 1 male?
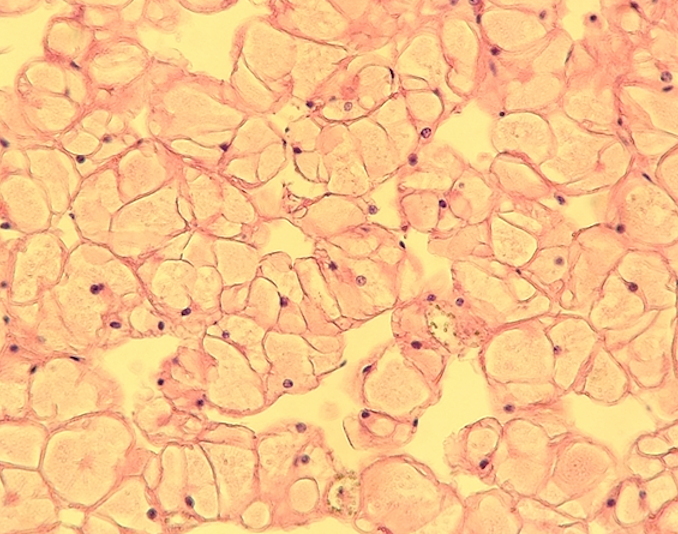
Figure 2. Gigas-7 from pre-exposure sampling. Grace marked this individual as female, but I think it more closely resembles a Stage 0 individual. I’m confident with that classification.
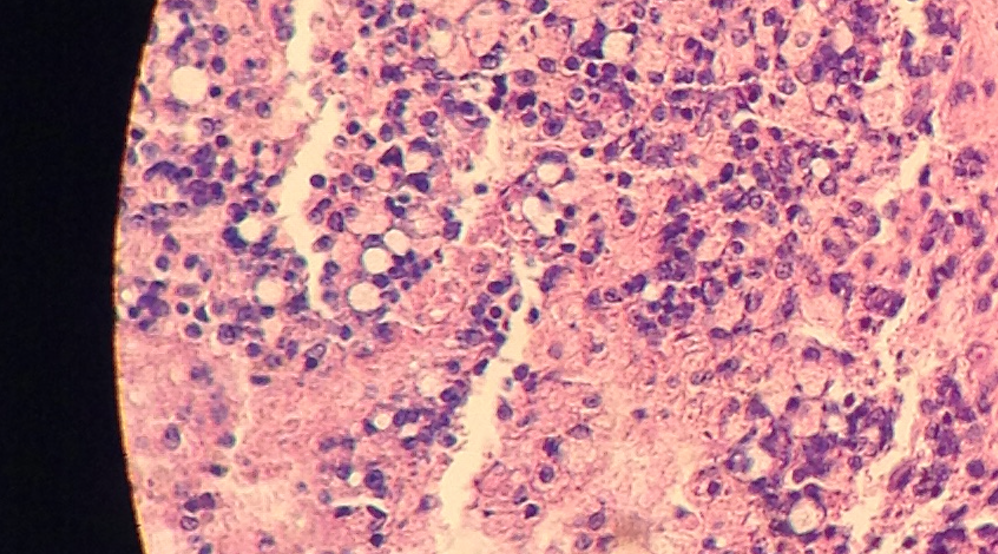
Figure 3. Uk-5 from post-exposure sampling. I classified this a Stage 4 male, but I wasn’t sure about those large white circles. Are those phagocytes or are they spent oocytes?
Based off of what I have, I generated some pie charts to visualize maturation state and sex ratios before and after exposure.
Pre-exposure:
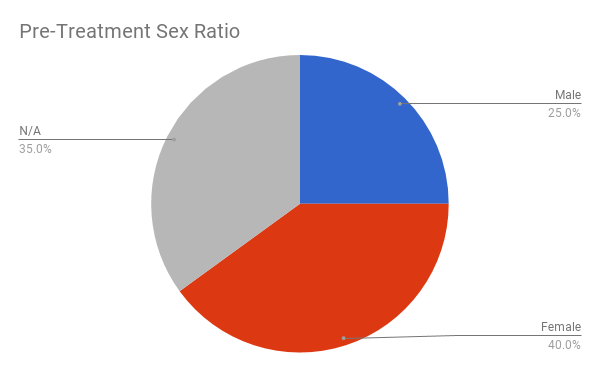
Figure 4. Sex ratio before pH exposure.
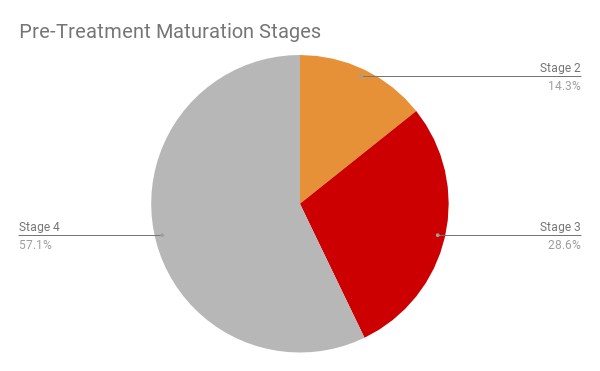
Figure 5. Maturation stages before pH exposure.
Post-exposure:
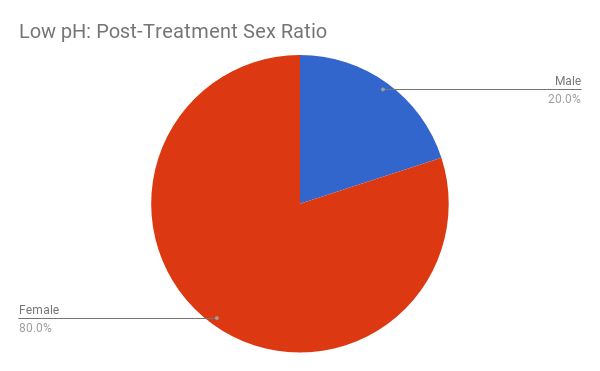
Figure 6. Sex ratio after low pH exposure.
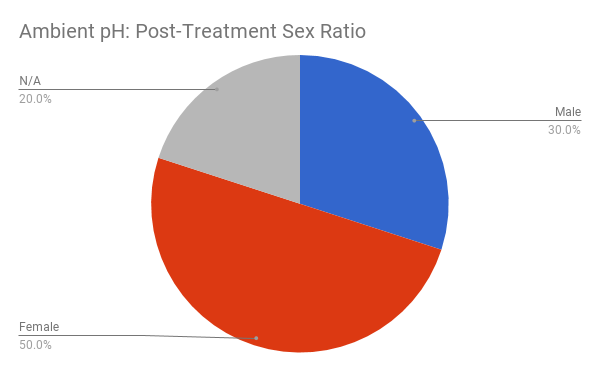
Figure 7. Sex ratio after ambient pH exposure.
From all 20 oysters sampled after exposure, there are more females than males. My ambient pH group had more N/As (Stage 0) than my low pH group.
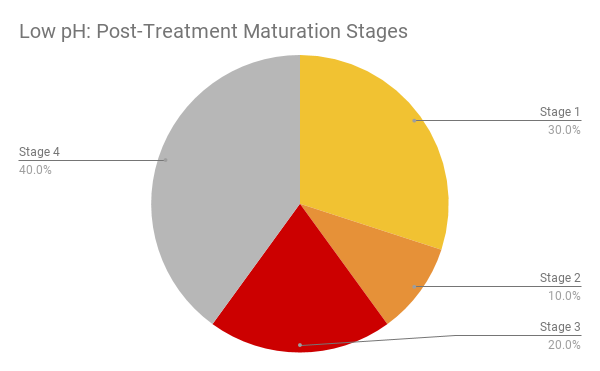
Figure 8. Maturation stage after low pH exposure.
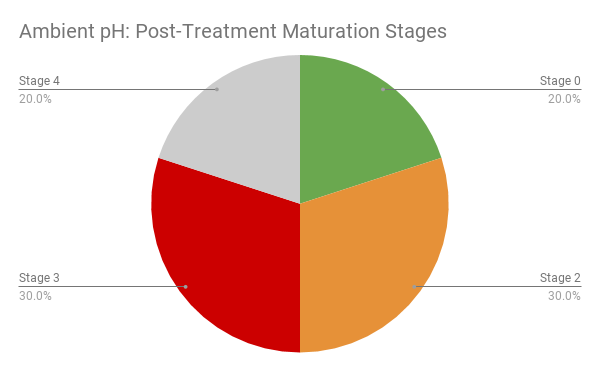
Figure 9. Maturation stage after ambient pH exposure.
The low pH oysters had more Stage 1 and Stage 4 oysters, while the ambient pH oysters had more Stage 2 and 3 oysters.
I’ll ponder these distributions and whether or not those differences are relevant later this week when I do some statistics.