Gonad Methylation Analysis Part 10
Visualizing bismark outputs
I started my IGV trials and tribulations yesterday, and today I’m (maybe) struggling a little less.
My goal was to use IGV to visualize 1) my alignment output and 2) bedGraphs from methylation extraction.
Alignment output
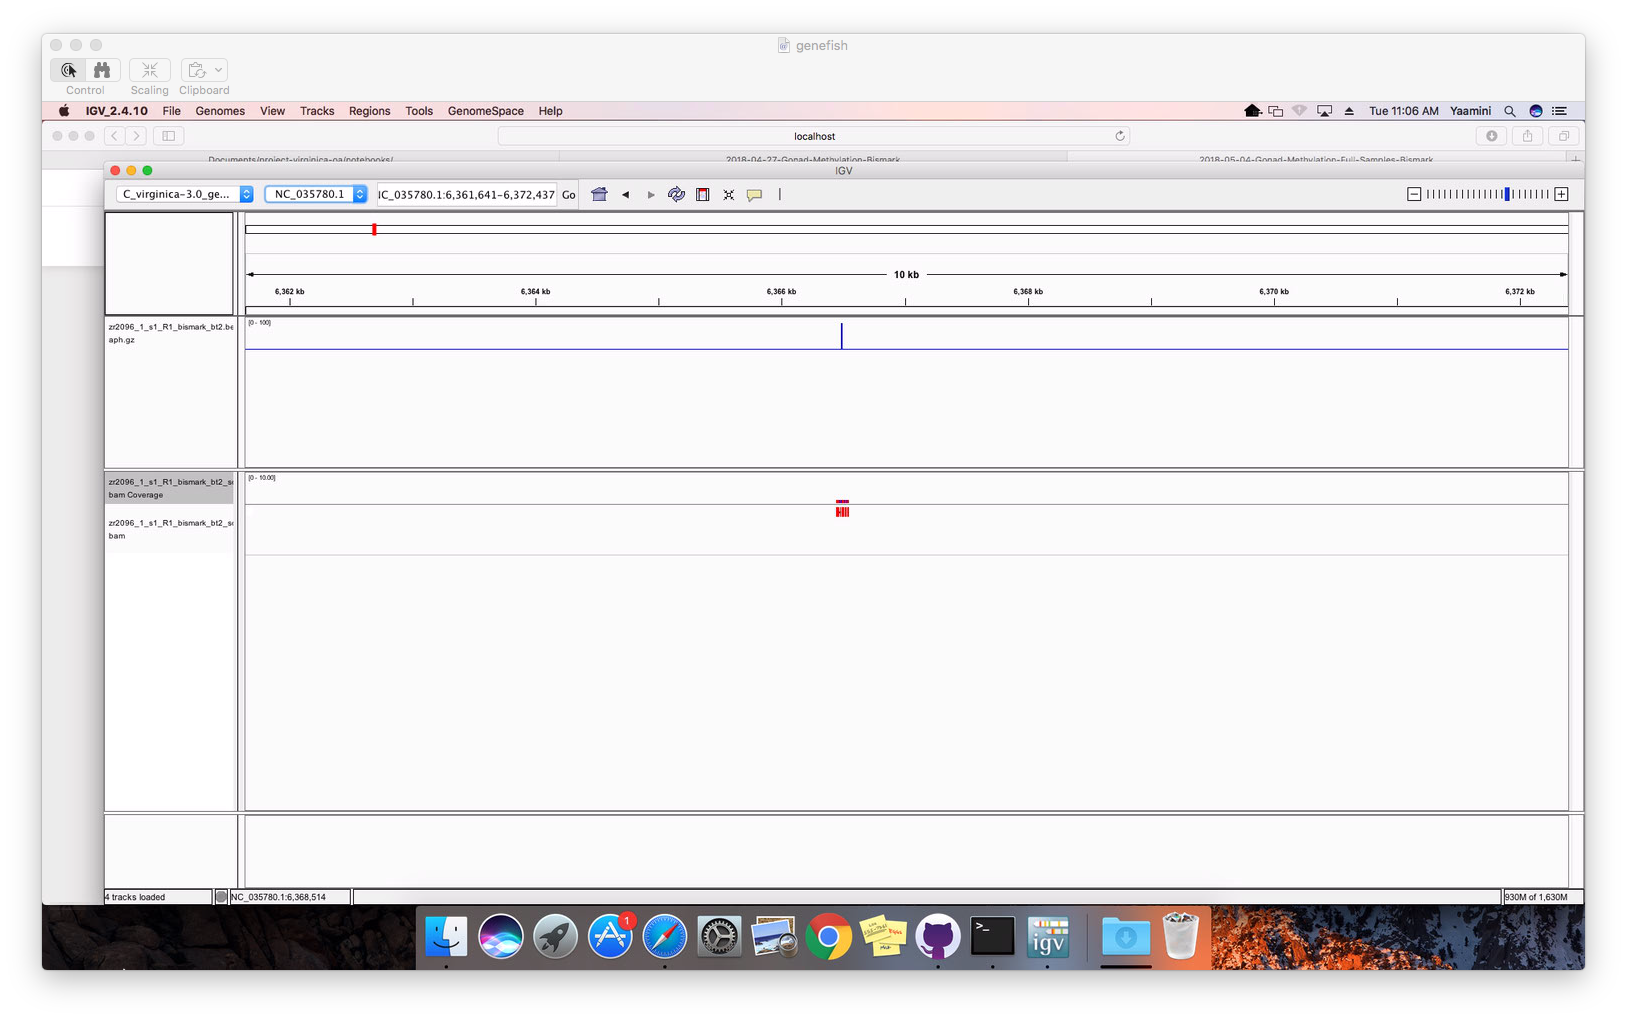
To visualize the alignment output, I first needed to sort and index the .bam output. I downloaded igvtools. In this lab notebook, I applied the sort and index command to one of my .bam files. I then uploaded this file to my IGV file.

Figure 1. IGV with .bam file.
I had to zoom to the single nucleotide level to view anything!

Figure 2. Alignment at single nucleotide level.
I wanted to add in my other alignment files, but I didn’t want to go through the pain of writing individual lines of code to convert the files (Sam tried to help me, but right now there doesn’t seem to be a solution. Steven also mentioned that I should have used deduplicate_bismark after the alignment, which would have sorted and indexed all my files. You can see the issue here).
bedGraphs
I uploaded all of the bedGraphs from the methylation extractor (found here) into my IGV file.

Figure 3. bedGraphs showing methylation levels for each file.
There isn’t any apparent difference between the two treatments. I looked at Steven’s lab notebook and he noticed the same thing. He also said that going to 100k made a difference. I have no idea what this means so I’ll have to ask him.