Hawaii Gigas Methylation Analysis Part 14
Messing around with methylKit DML settings
The R Studio server works!
Last time I mentioned how the R Studio server wasn’t playing well with my R Markdown script, and that I started running an R script for the analysis instead. Turns out making the switch is what I needed to run my code! When I was working on the Manchester analysis, I did end up using an R script instead of an R Markdown file. This makes me think that there’s some sort of issue using R Markdown on R Studio server, specifically with calculateDiffMeth. Something to investigate at a later date.
Evaluating methylKit DML output
After unite, I had 1,984,530 CpG loci with data in all 24 samples. Using this object with calculateDiffMeth (including covariates and an overdispersion correction), I didn’t obtain many ploidy- or pH-DML:
Table 1. Number of DML obtained from various methylation difference thresholds.
| Contrast | 25% | 50% | 75% |
|---|---|---|---|
| Ploidy | 1 | 0 | 0 |
| pH | 4 | 1 | 0 |
Table 2. DML obtained at various percent methylation differences for ploidy or pH contrasts.
| Contrast | chr | start | end | pvalue | qvalue | meth.diff |
|---|---|---|---|---|---|---|
| ploidy | NC_047566.1 | 46447078 | 46447080 | 8.71E-13 | 1.62E-06 | 37.3155448 |
| pH | NC_047561.1 | 7843128 | 7843130 | 5.50E-08 | 0.0044294 | -26.315789 |
| pH | NC_047565.1 | 4762558 | 4762560 | 3.96E-08 | 0.00364724 | -26.731667 |
| pH | NC_047565.1 | 44578741 | 44578743 | 1.23E-07 | 0.00671761 | -26.789645 |
| pH | NC_047567.1 | 9113140 | 9113142 | 9.18E-08 | 0.00610252 | 50.1223071 |
| pH | NC_047567.1 | 9113140 | 9113142 | 9.18E-08 | 0.00610252 | 50.1223071 |
I wasn’t expecting many DML from this analysis because of the covariate information, but I’m surprised I don’t have at least a hundred for one of the contrasts. It’s also interesting that all of the DML are found in one chromosome. I should look into that further when I have my final DML list.
Changing min.per.group within unite
Steven suggested I change the min.per.group parameter in the unite command to allow for loci without data in all samples to be included in the analysis. I started by allowing a CpG to be present in 9/12 samples per treatment (75%):
methylationInformationFilteredCov5 <- methylKit::unite(processedFilteredFilesCov5,
                                                       destrand = FALSE,
                                                       min.per.group = 9L) #Combine all processed files into a single table. Use destrand = TRUE to not destrand. Based with data in at least 9/12 samples peer treatment will be included
With this change, I had 4,557,452 CpG loci with data in at least 9 samples per treatment. I got more DML this time, but still less than 100! Looking at my reference script from another paper, it seemed like they tried out several min.per.group options. For reference, I have between 5,173,369 and 8,057,460 CpG loci with data with at least 5x coverage, depending on the sample. Since I’m getting 4,557,452 after unite with min.per.group = 9L, I’m not sure if it’s worth doing something similar to 1) count the number of CpG loci with data and 2) count the number of DML obtained with multiple settings. However, I decided to try min.per.group = 8L, which gave me 5,103,729 CpGs.
Table 3. Number of DML obtained from various methylation difference thresholds using min.per.group = 9L or min.per.group = 8L.
| Contrast | min.per.group | 25% | 50% | 75% |
|---|---|---|---|---|
| Ploidy | 9 | 19 | 0 | 0 |
| Ploidy | 8 | 29 | 1 | 0 |
| pH | 9 | 32 | 2 | 0 |
| pH | 8 | 42 | 3 | 0 |
Based on Table 3, I think I need to use a 25% threshold for calling DML. Again, I’m pretty sure my use of covariates is affecting the P- and q-values I get from methylKit. I think I’ll also use the min.per.group = 8L output, since I get marginally more DML.
Redoing comparative analysis with min.per.group = 8L
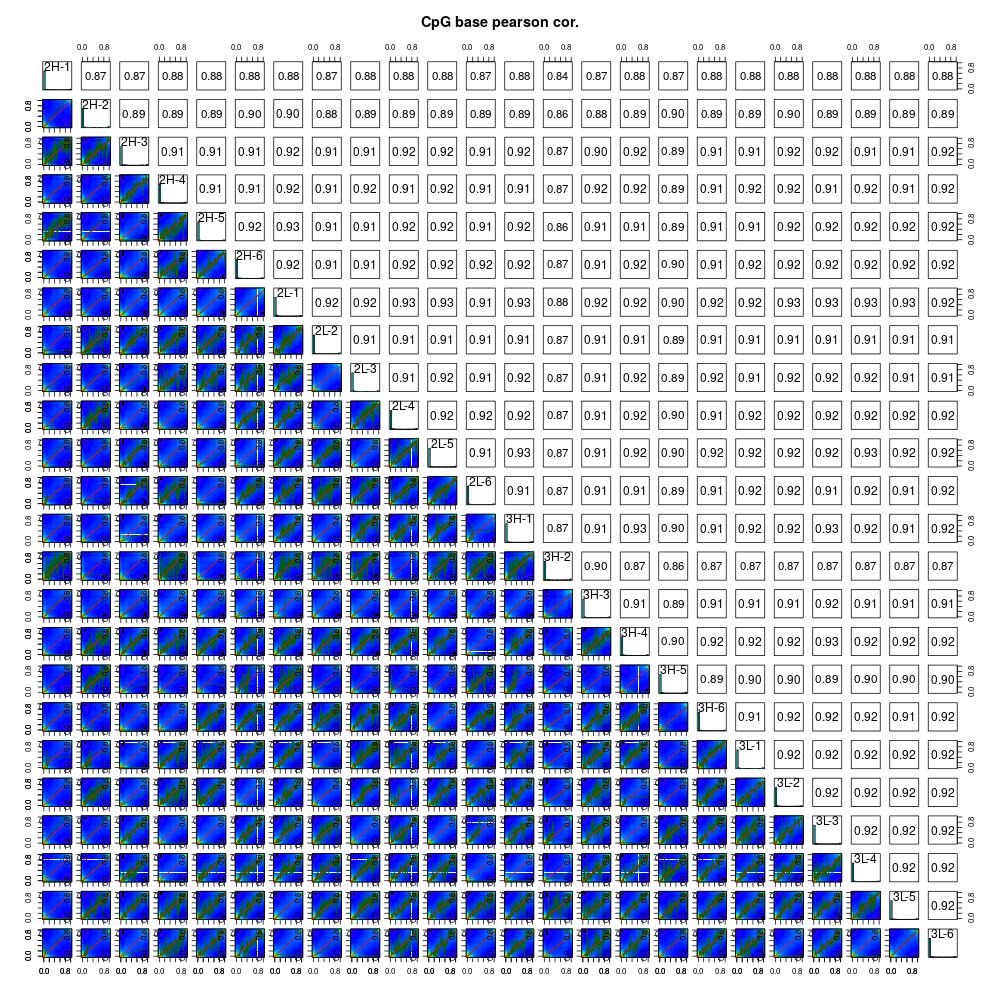
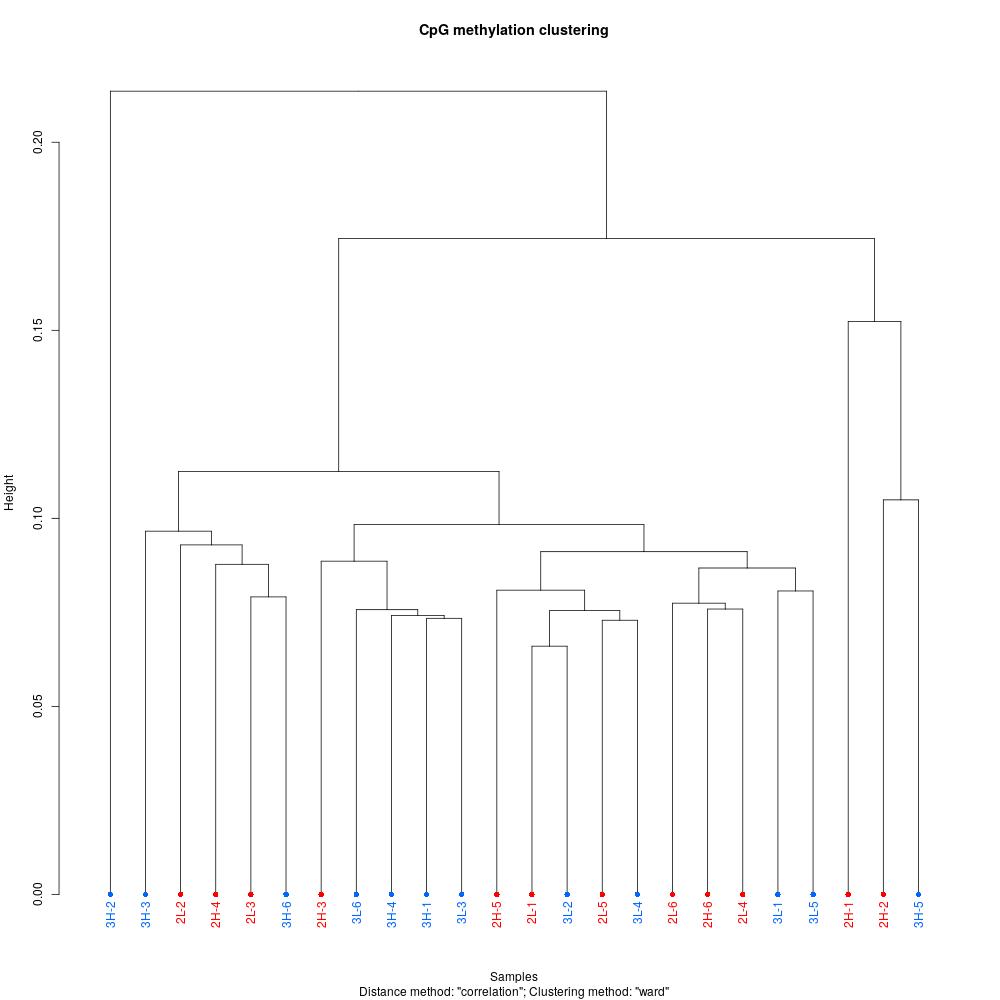
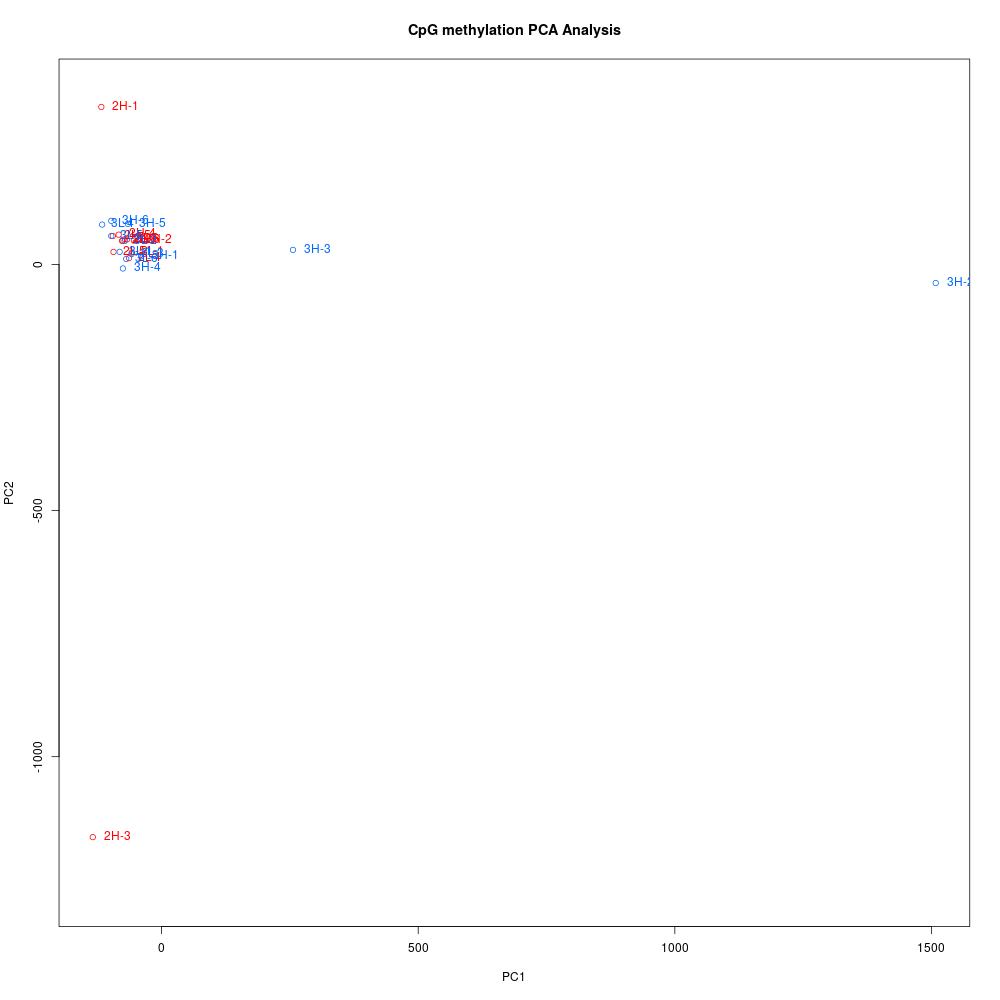
My previous comparative analysis used the default settings: CpGs must have data in all samples to be included in downstream analysis. I re-did the comparative analysis with the min.per.group = 8L parameter.

Figure 1. Correlation plot

Figure 2. Clustering diagram

Figure 3. PCA
The PCA and clustering diagram don’t look very different, but the correlations between samples are lower 0.01. Overall, nothing that rocks the boat.
Going forward
- Test-run DSS and ramwas
- Look at DML in IGV
- Try EpiDiverse/snp for SNP extraction from WGBS data
- Run
methylKitrandomization test onmox - Investigate comparison mechanisms for samples with different ploidy in oysters and other taxa
- Characterize the general methylation landscape
- Identify genomic locations of DML
- Transfer scripts used to a nextflow workflow
- Update methods
- Update results