
Larval Mortality Analysis
Do I have a story for my larval data?
The short version: Maybe not
The long version:
I’m preparing to write up my submission for the Journal of Shellfish Research’s Special Issue on Ocean Acidification. My paper will follow the general outline of the talk I gave at NSA 2018, so at least the difficult, conceptual thinking part is done! The only thing I have left is to figure out if it’s worth adding my larval data to the story. To do this, Steven suggested I first plot all of my data with error bars. I decided to go back a step and plot my data without error bars first. Calculating all of the standard deviations and manually adding error bars is annoying, and if there’s already a lot of overlap between my data points, I can get a good understanding for whether or not their mortality rates were different. Cue the R graphics
When analyzing my Day 0 count data, I saw a significant maternal effect from the pregametogenic pH treatment. The goal with these graphs is to see if the carryover effect persists into larval survival. In my R script, I visualized all of my data from the four different parental pH treatment families (i.e. everything besides the heat shock data). I plotted all of the data together, as well as the data from each family separately.
I know what you’re thinking. The axis labels and points are too small, the y-axis label is cutoff, and the colors aren’t high contrast enough. I was too lazy to adjust these aspects of my plots if I wasn’t sure if they would be used later on. Lazy, but efficient…?
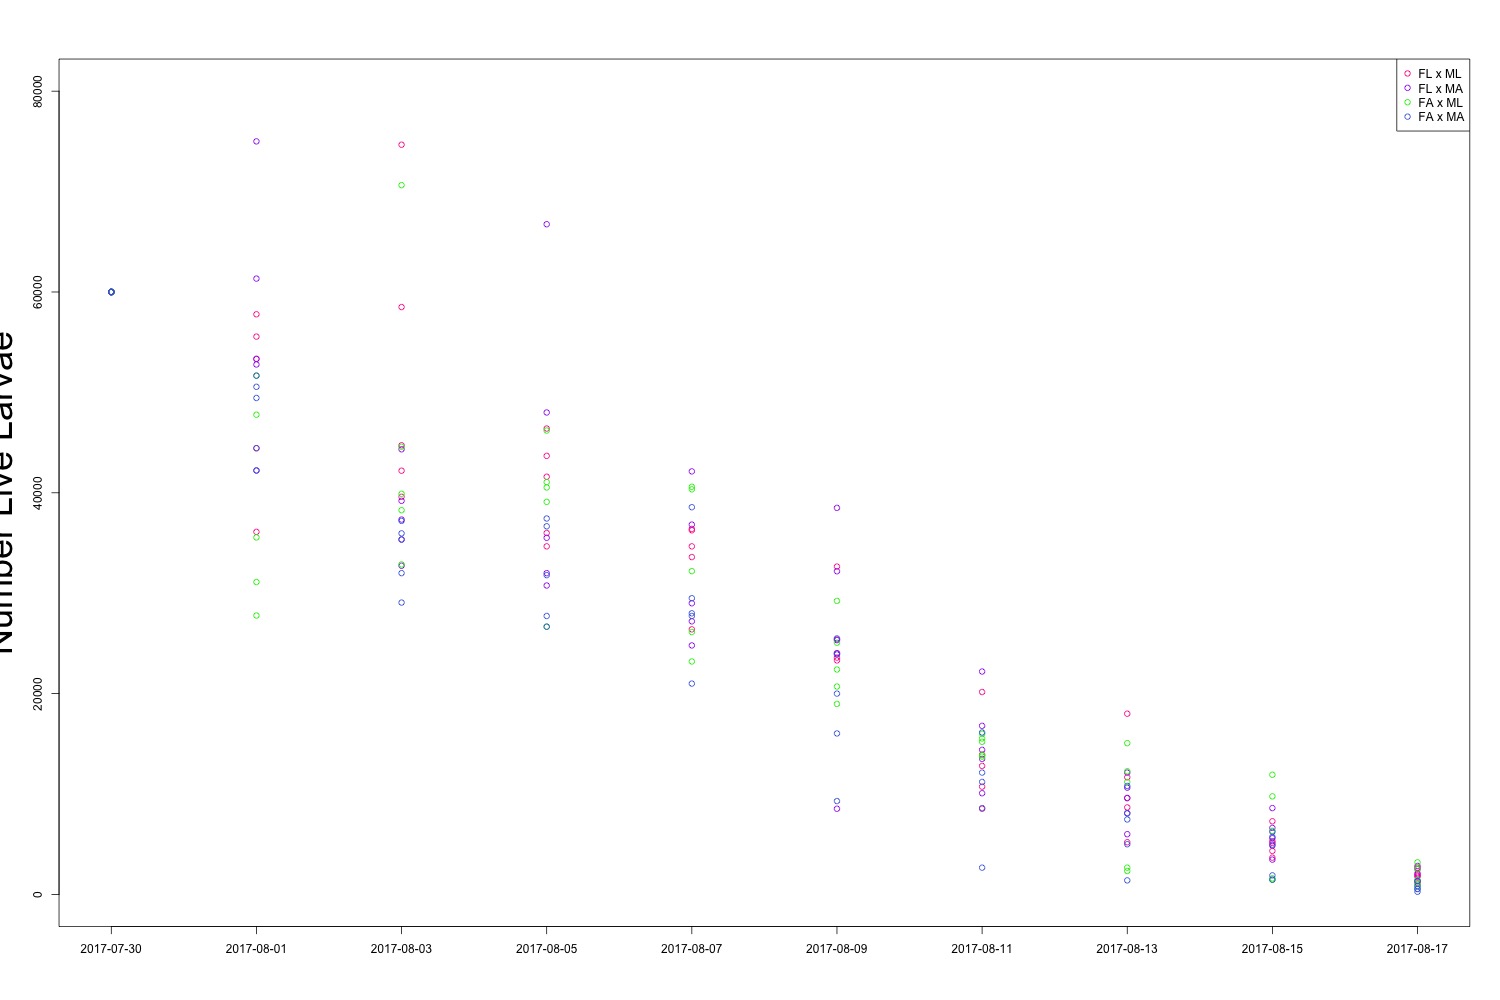 Figure 1. All larval count data over the course of the experiment. The big takeaway here is that all of the colors are overlapping.
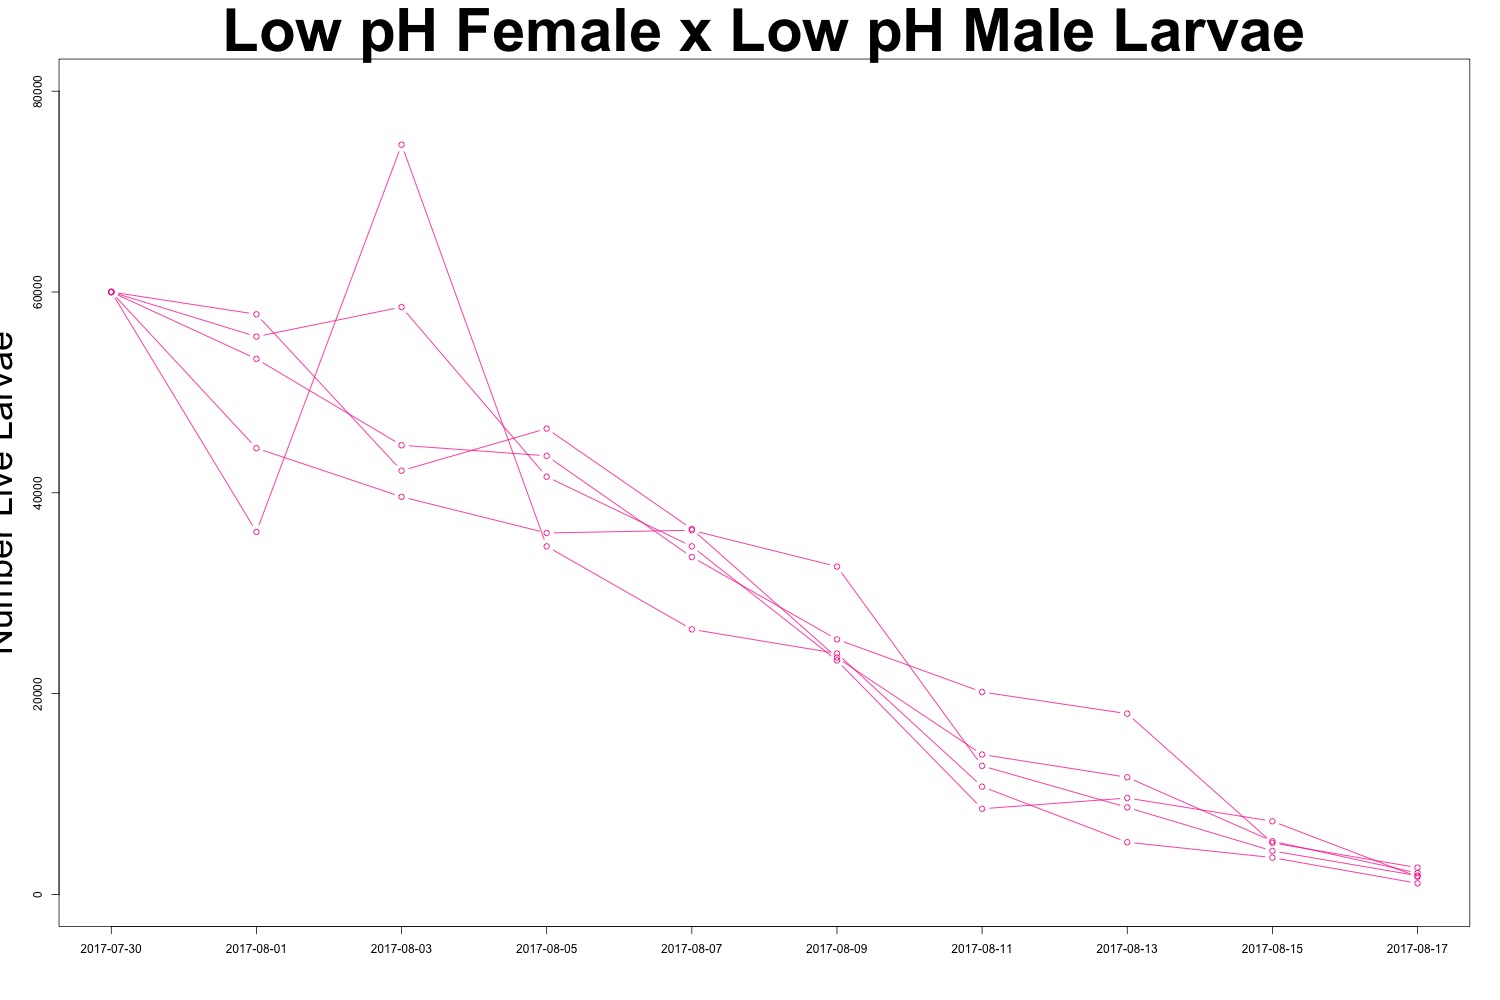
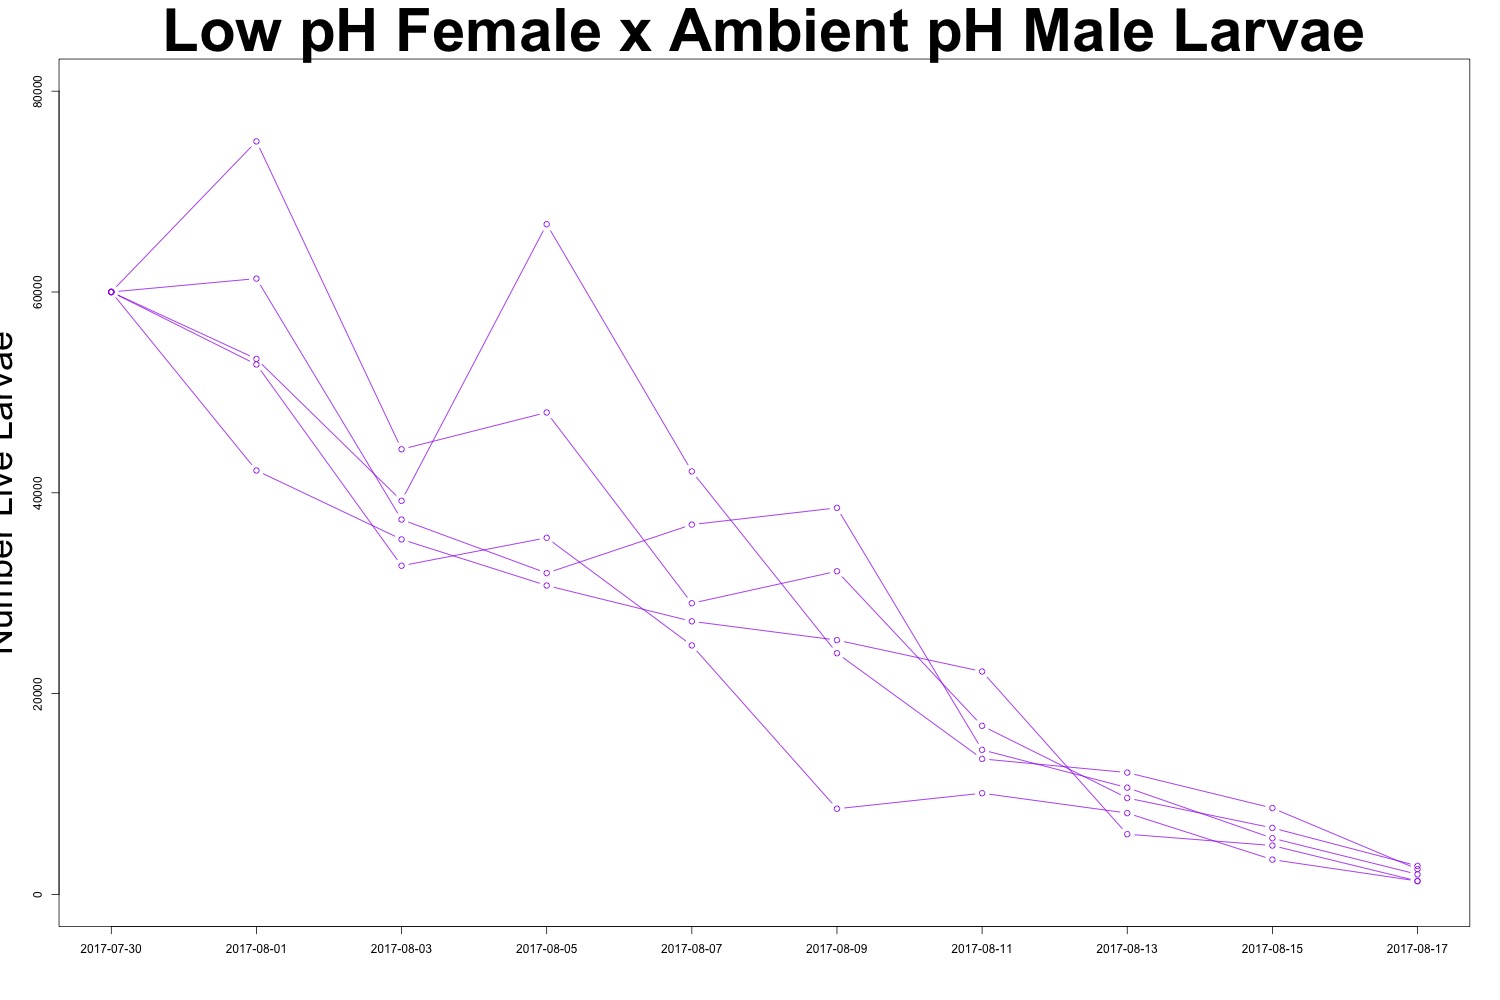 Figures 2-3. Larval count data from families with females exposed to low pH conditions. Males were exposed to either low pH (top) or ambient pH (bottom).
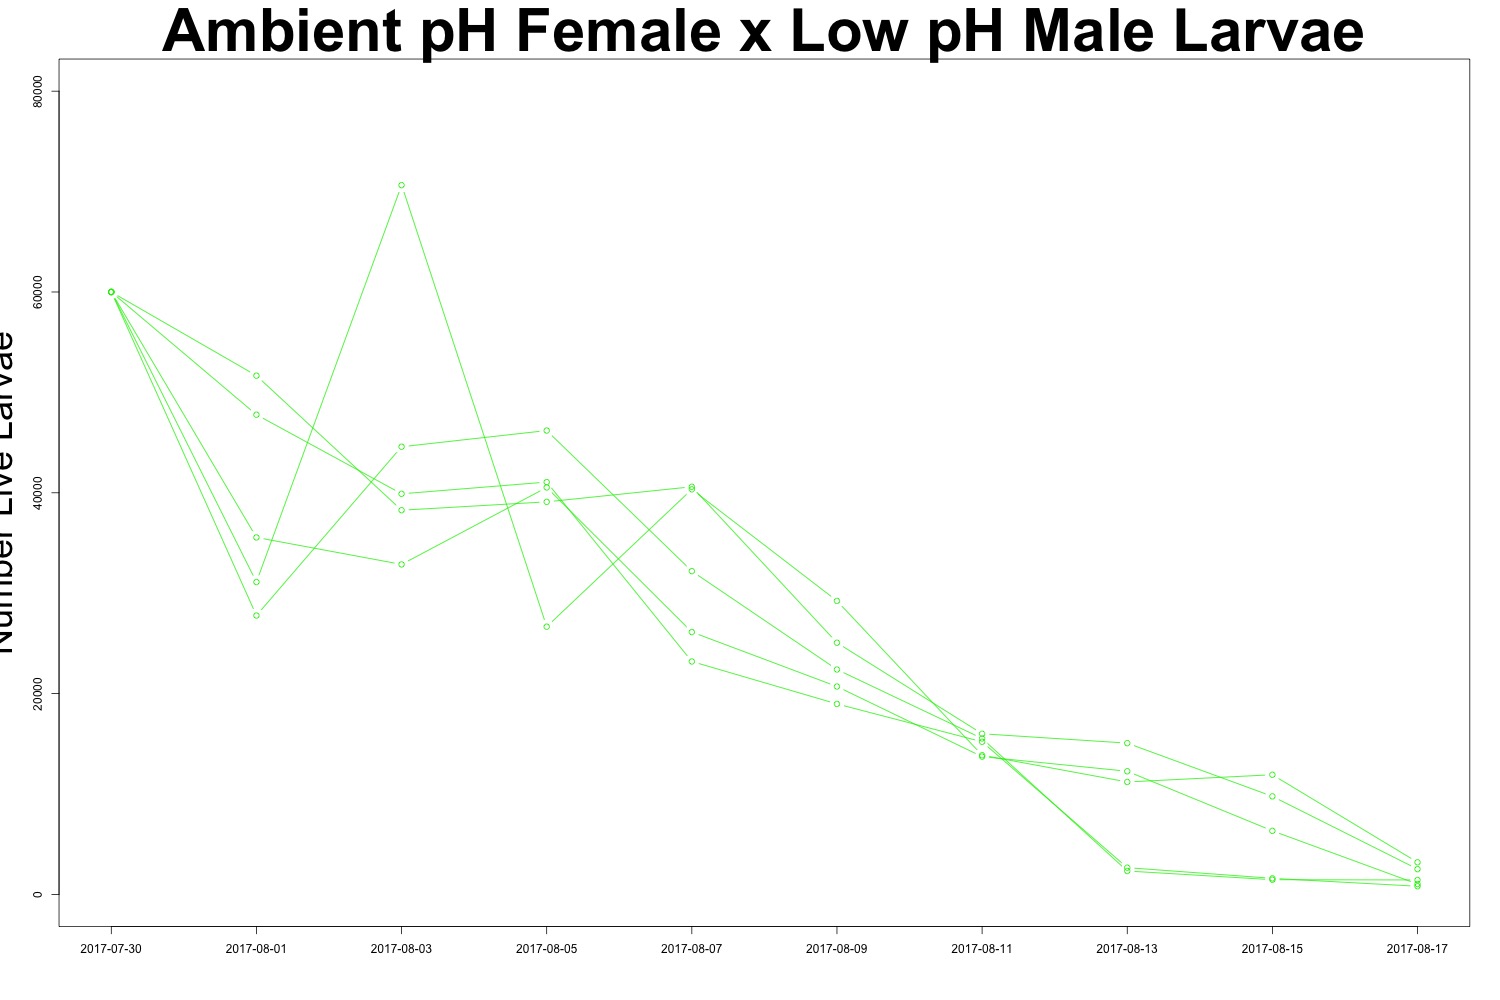
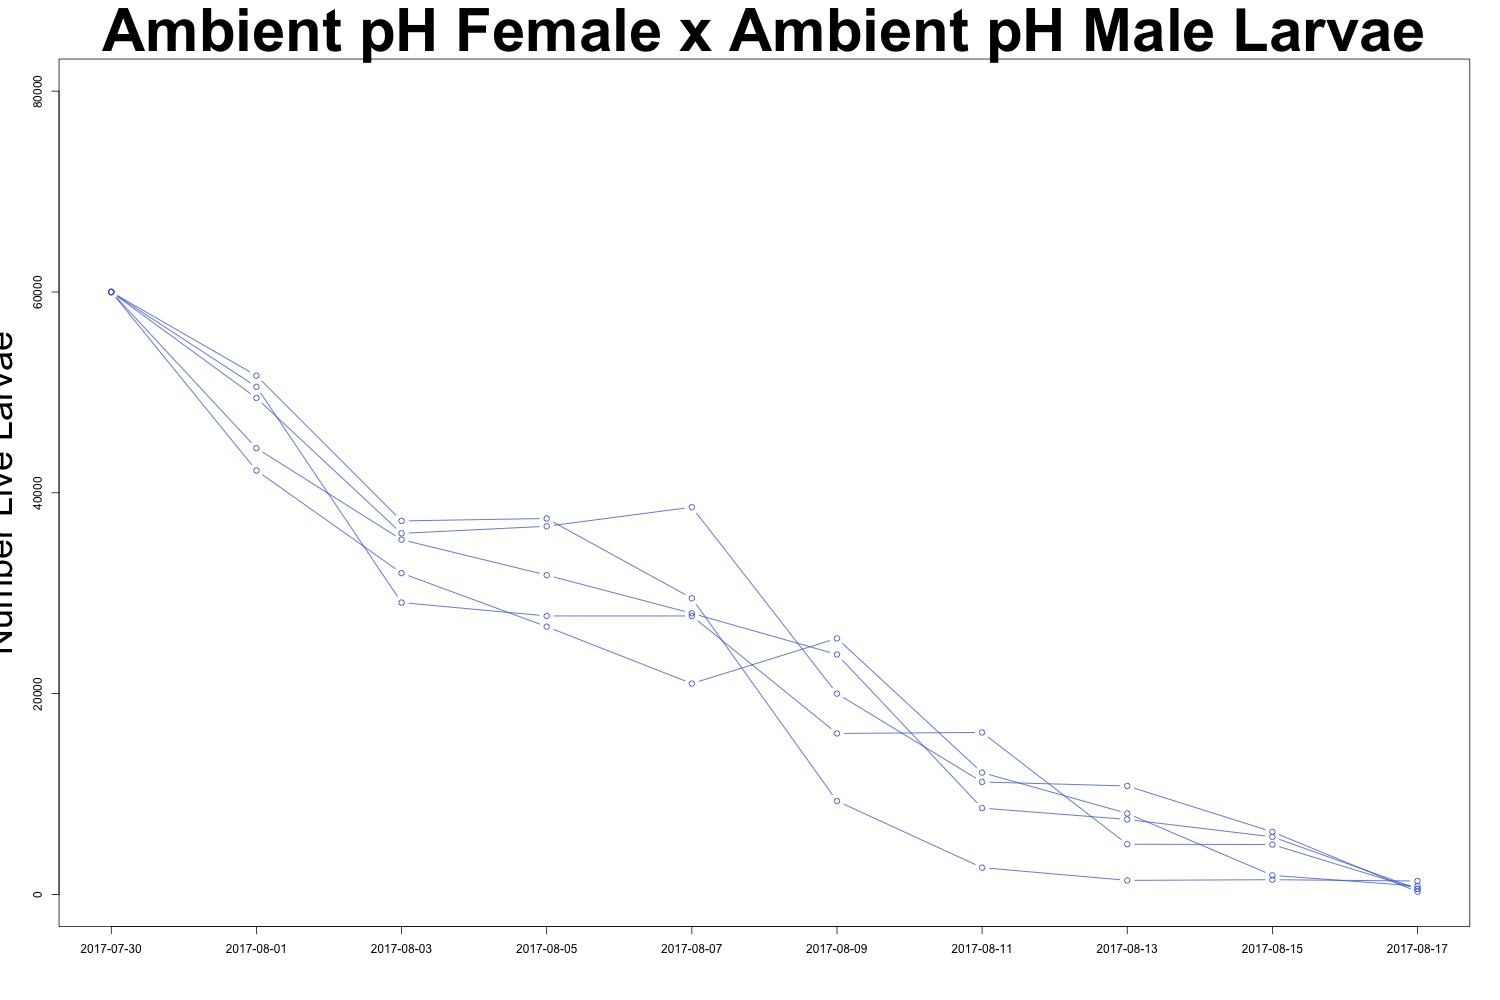 Figures 4-5. Larval count data from families with females exposed to ambient pH conditions. Males were exposed to either low pH (top) or ambient pH (bottom).
It may be useful to create a multipanel plot to look at the families side by side. I’ll see if this is necessary. There is evidence of human error when counting larvae (how did I count more larvae than I started with?!), but it seems to be day-dependent as opposed to treatment-dependent. It doesn’t look like there’s any significant difference in survival between treatments, which could also be an interesting point. While we saw a carryover effect when counting larval output, that same effect may not persist into larval survival. Sometimes a null result is still a cool result.
My next step is to channel my inner Mac and write the methods and results section of my paper (or, at least get a Google Doc and paper repository started first). I’ll include this section and if I or others feel it is not relevant, I’ll eliminate it.