
Remaining Analyses Part 2
Everything at the peptide level
Steven suggested that I integrate my transition data and work only at the peptide level. To do this, I went back into Skyline and created a duplicate Skyline document. I removed the technical replicates for samples I previously deemed poor quality.
Under the Skyline settings, I selected “Integrate All.”

Figure 1. “Integrate All” settings found in Skyline.
When exporting my report, I added a “Total Area” column. This can be found under “Precursor Settings.” It sums all of the area data for each transition associated with a precursor, eessentially integrating all the area data I have for each peptide.
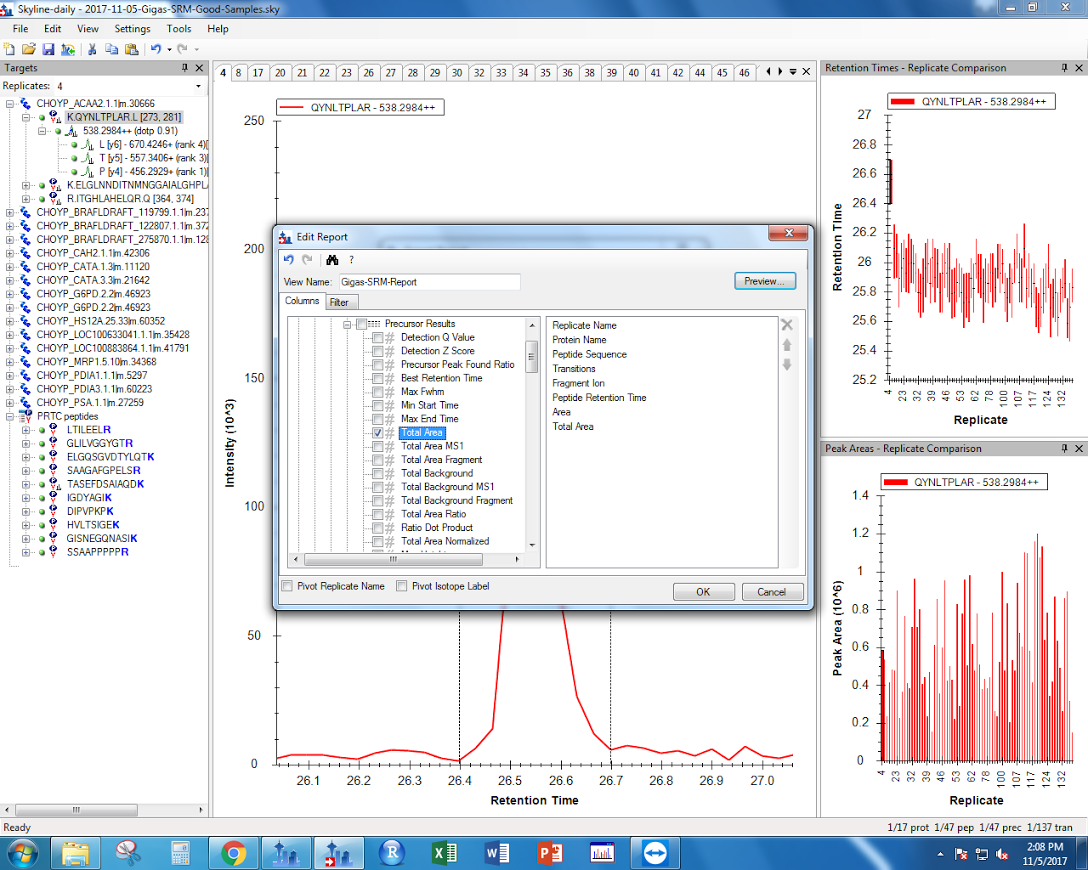
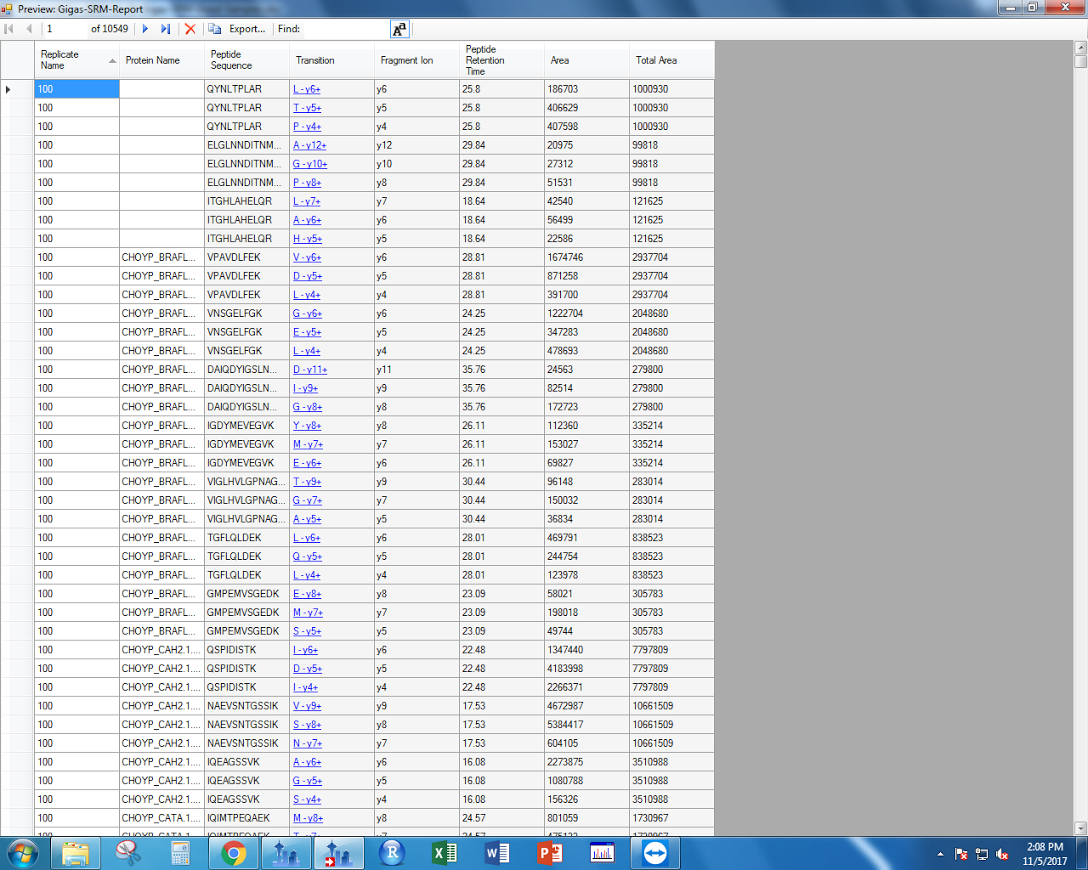
Figures 2-3. “Total Area” data to export from Skyline.
I exported the data, which can be found here.
I then examined the technical replication of my samples in this R script. Again, some of my samples had better technical replication than others, but this looks like an improvement…? There were smaples with large ordination distances, so I wonder if removing those samples would be a good place to dive into my analyses.
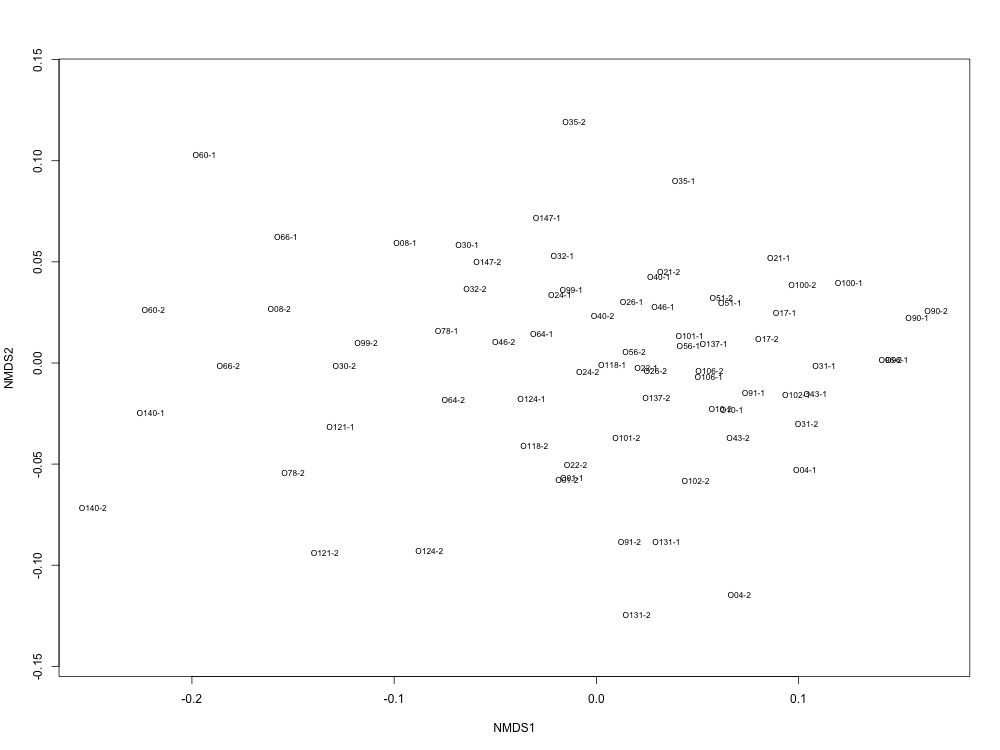
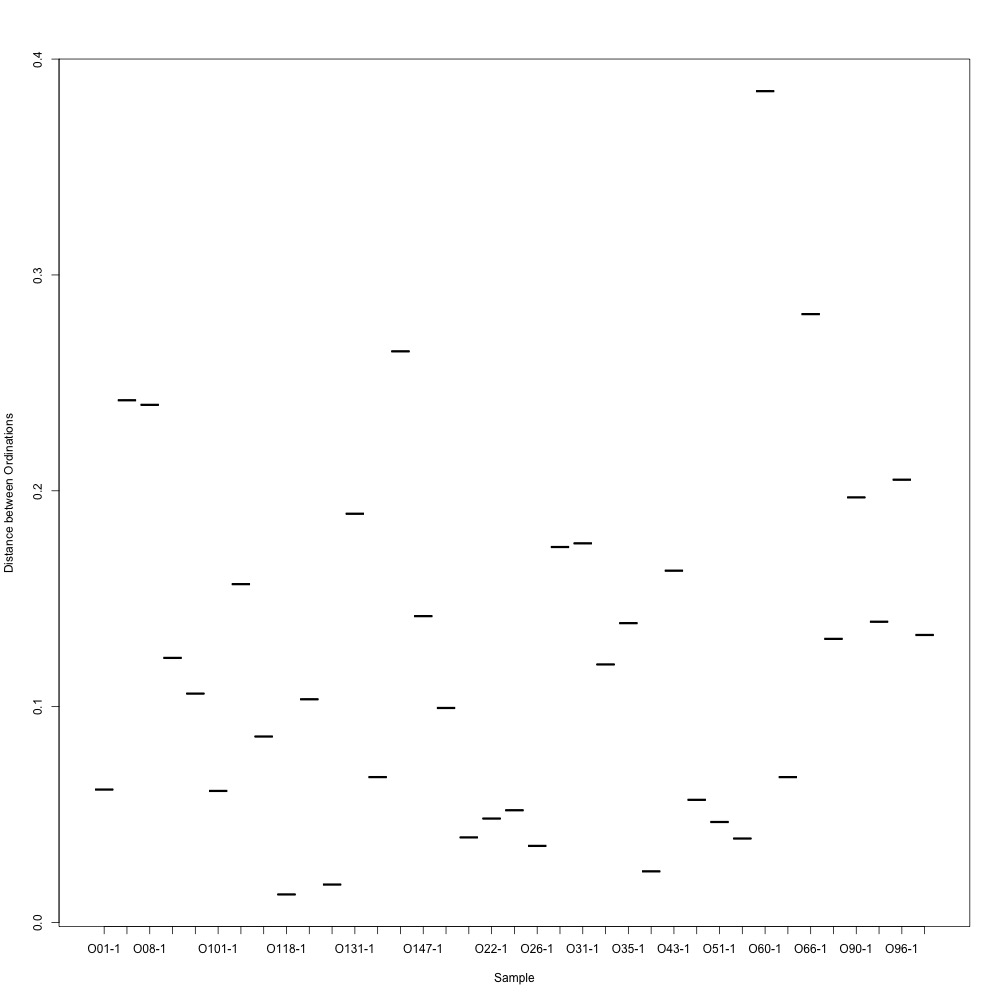
Figures 4-5. NMDS for technical replication and ordination distances between replicates.
I wrote out the area data for my technical replicates and fed it into this script to average my replicates and perform cluster analyses.
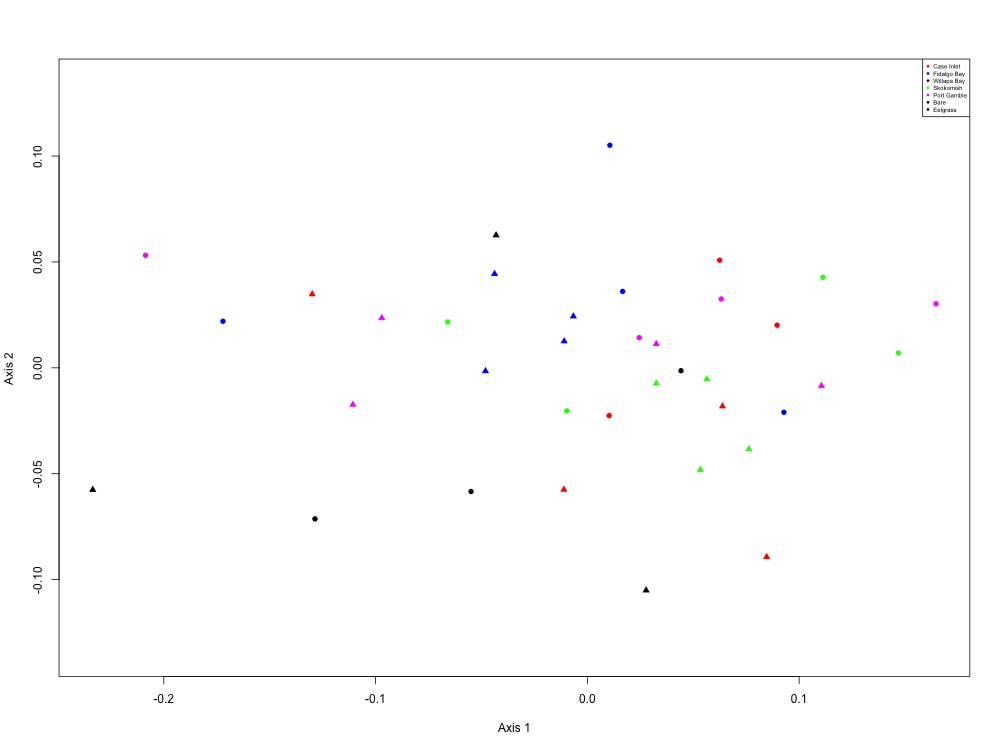
Figure 6. NMDS using all peptide areas for all samples. No significant clustering patterns were found based on site, eelgrass, or both criteria.
No patterns really leapt out at me, but I could more easily pick out Skokomish River Delta and Willapa Bay from the other sites. I wonder if there’s some sort of regional effect here? Either way, here are my ANOSIM results:
Site only: R = 0.0504, Significance = 0.105 Eelgrass/Bare only: R = 0.05031, Significance = 0.09 Both: R = 0.05664, Significance = 0.169
Based on Laura’s suggestion, I also made NMDS plots grouping proteins together by function in this script. None of them really looked interesting except for the oxidative stress and growth and maintenance plots, but I didn’t jot down the ANOSIM results since they weren’t significant at the site or eelgrass level.
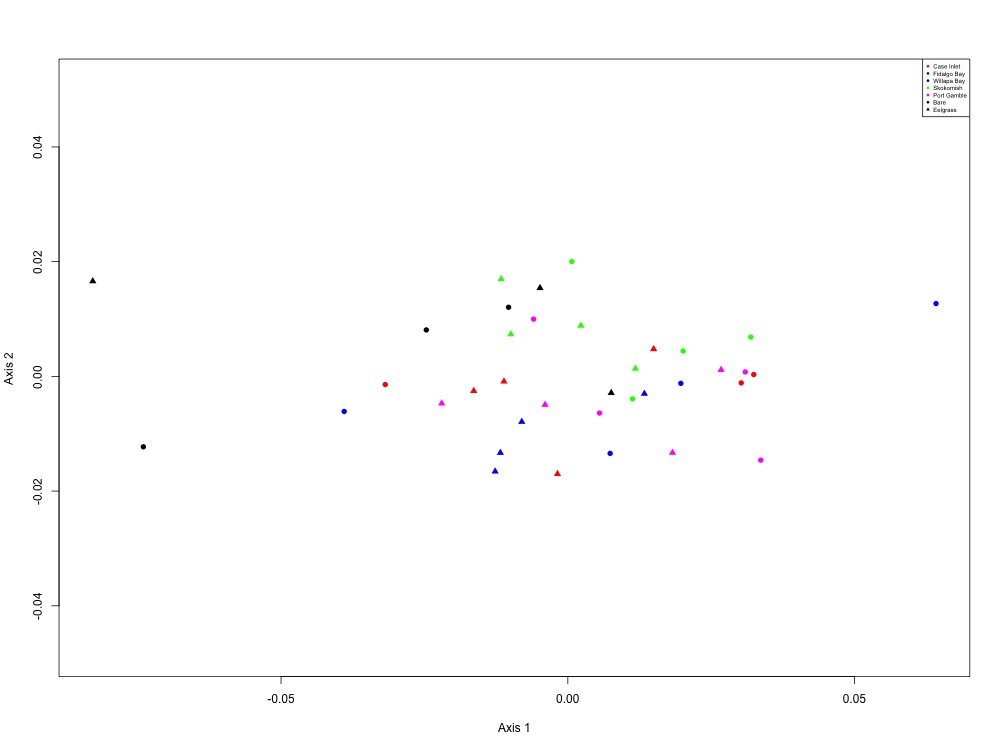
Figure 7. Oxidative stress NMDS (4 proteins).
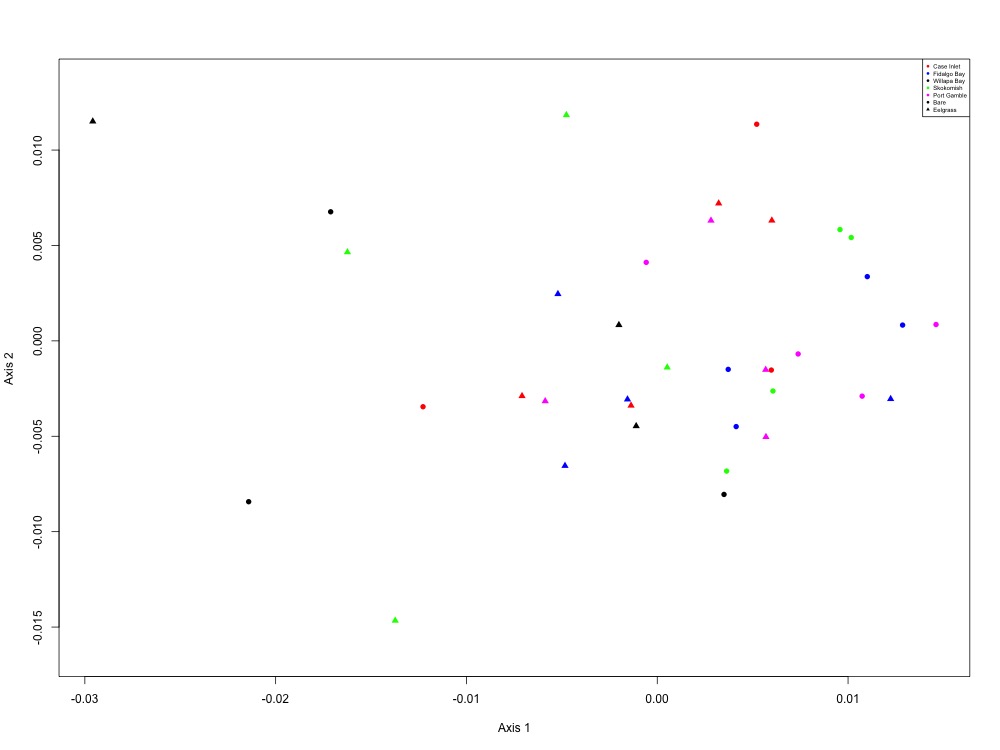
Figure 8. Heat shock NMDS (1 protein).
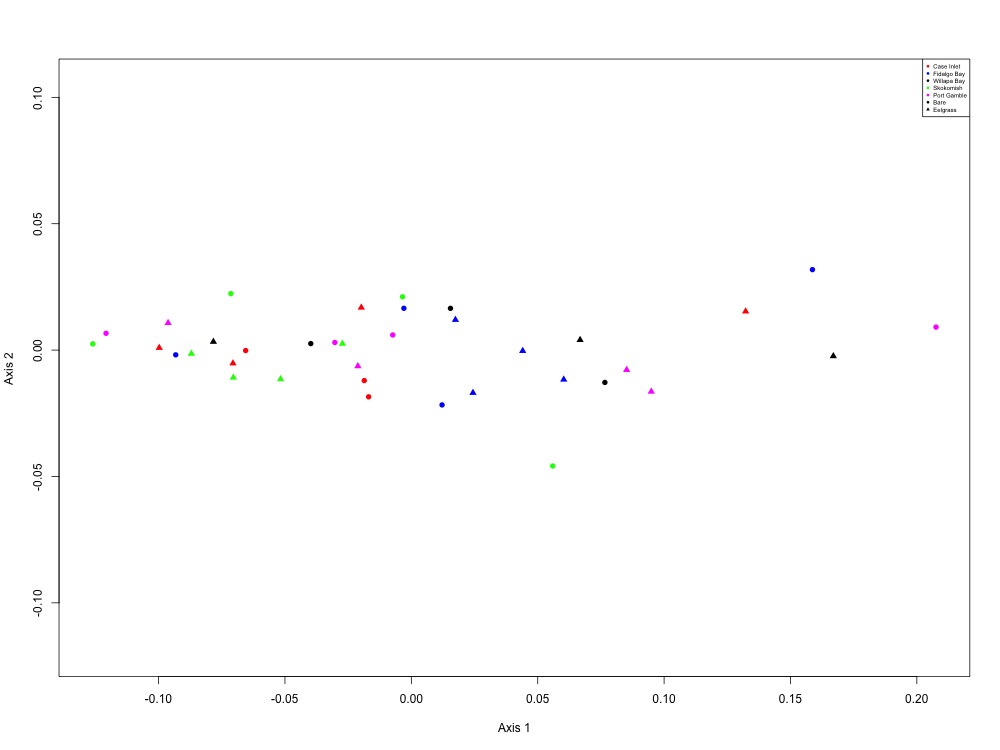
Figure 9. Acid-base balance NMDS (1 protein).
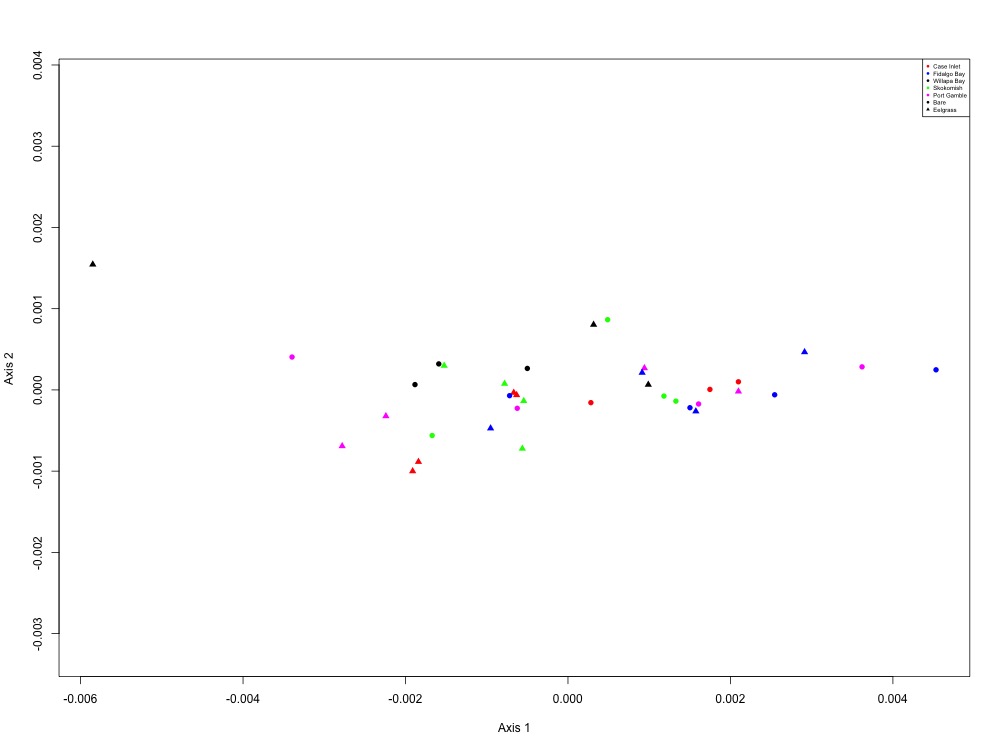
Figure 10. Drug resistance NMDS (1 protein).
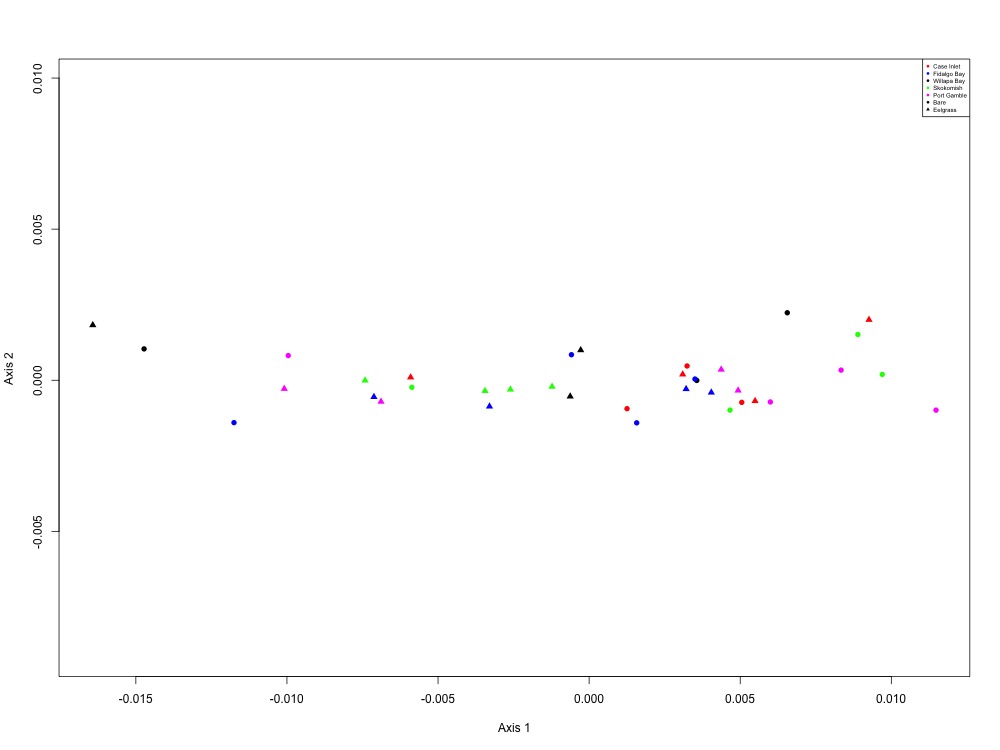
Figure 11. Fatty acid metabolism NMDS (1 protein).
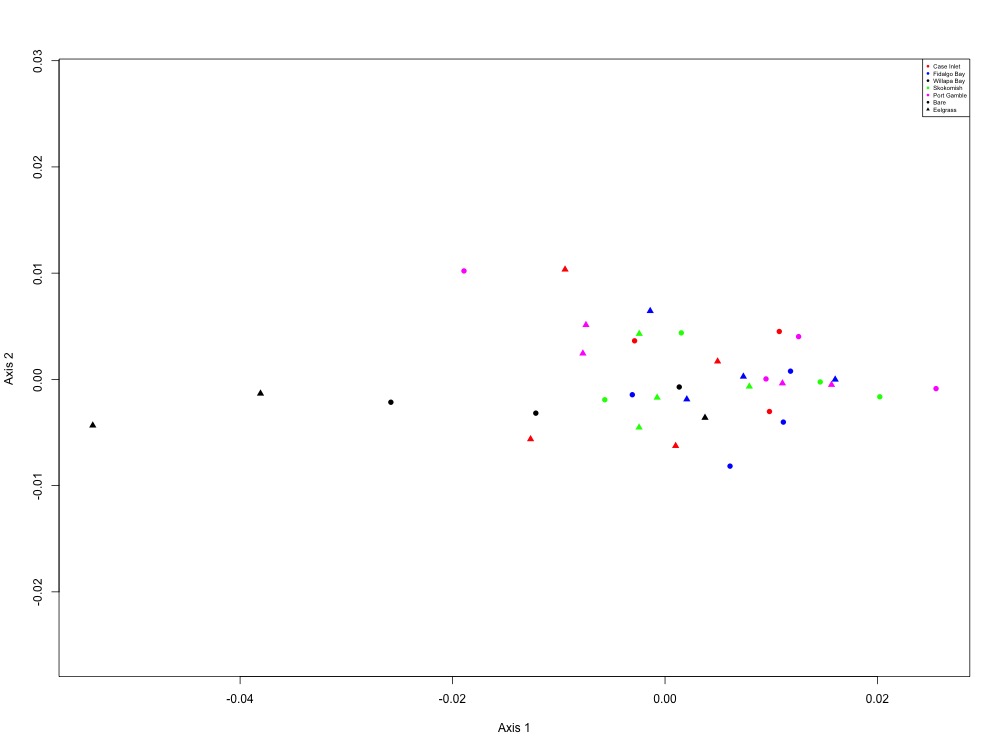
Figure 12. Carbohydrate metabolism NMDS (2 proteins).
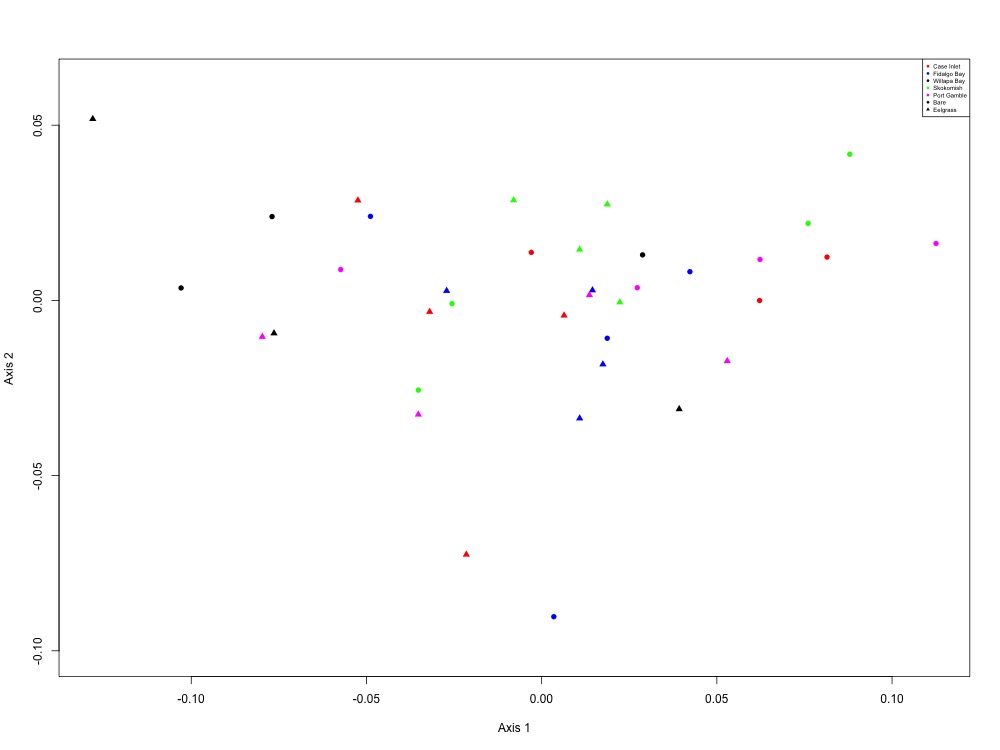
Figure 13. Cell growth and maintenance NMDS (5 proteins).
Finally, I made boxplots for each peptide characterizing protein expression with this script. I only made the boxplots using site distinctions since my NMDS and ANOSIM analyses showed no significant differences in clustering based on habitat. Boxplots can be found in this folder. I found these boxplots to be less interesting than the ones I made at the transition level.
Now I think I need to start looking into the significance of my protein expression by performing some t-tests or an ANOVA.