Remaining Analyses Part 20
This series has (finally) come to an end
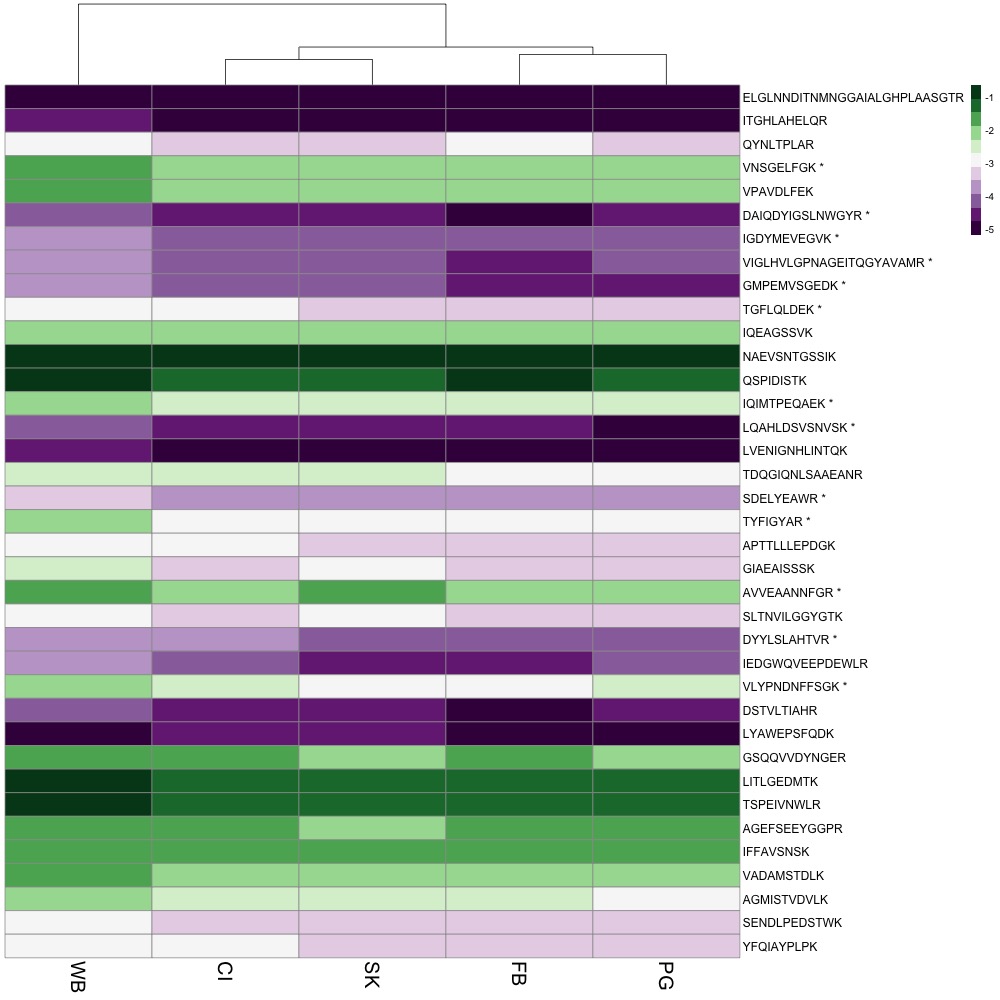
I showed Steven, Emma, and Brent my heatmap options and we decided to include all peptide abundance data, not to cluster rows, and to go with the purple-green color scheme.
I sent the figure to my friend with red-green confusion, and he said he could understand it! In my R Script, I started playing around with other modifications.
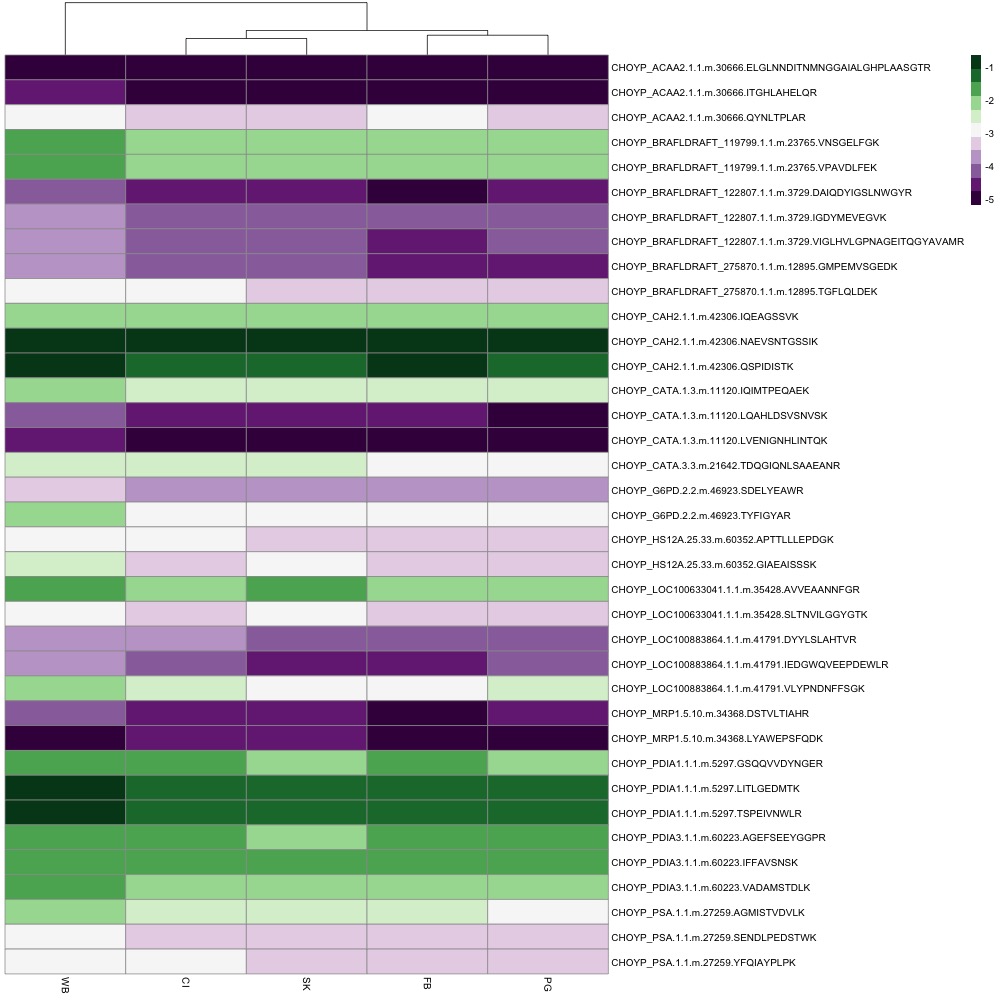
The first thing I did was switch out complicated protein names for common names. I created a .csv file that matched protein name, common name, and peptides. I also added an asterisk to the end of each peptide that exhibited differential abundance. I used the common name and peptide to identify rows in the heatmap. I also added a title and tried making some of the font size bigger. pheatmap is not a package that’s easy to manipulate if you want to change the aesthetics of your plot. I’ll probably have to do more work in Powerpoint, Photoshop or InDesign (which sucks because that’s not reproducible).
For now, here’s my figure!