
Remaining Analyses Part 23
Revised salinity data!
The good news: I have actual, real salinity data now
The bad news: Salinity no longer explains my protein abundance data
Micah sent me new salinity data. The original data was salinity that was incorrectly converted from conductivity. Here are Micah’s notes:
Data availability: Data for Port Gamble Bare were unavailable due to instrument failure Instruments at Skokomish Bare and Skokomish Eelgrass were deployed on 06/22/16, so there are no data before that date at this site
Data treatment: Conductivity observations less than 0 were removed (these occur when the instrument is dry) Salinity was calculated from conductivity using the swSCTp command in R package ‘oce’, with temperature at 25°C and pressure at 10dbar
Qualitative: Looking at these data, I think something went wrong at Case Inlet Eelgrass, Fidalgo Bay Bare, and Willapa Bay Bare. Declining values or sporadic low values suggest that the instruments were buried or clogged at some point. Skokomish Bare and Skokomish Eelgrass had really different salinities!
I then ran the revised salinity data through this script to quality control it using tidal data, then created graphs with this script. I still need to run it through this script to extract important environmental variables. However, I saw that Willapa Bay no longer has the lowest salinity!
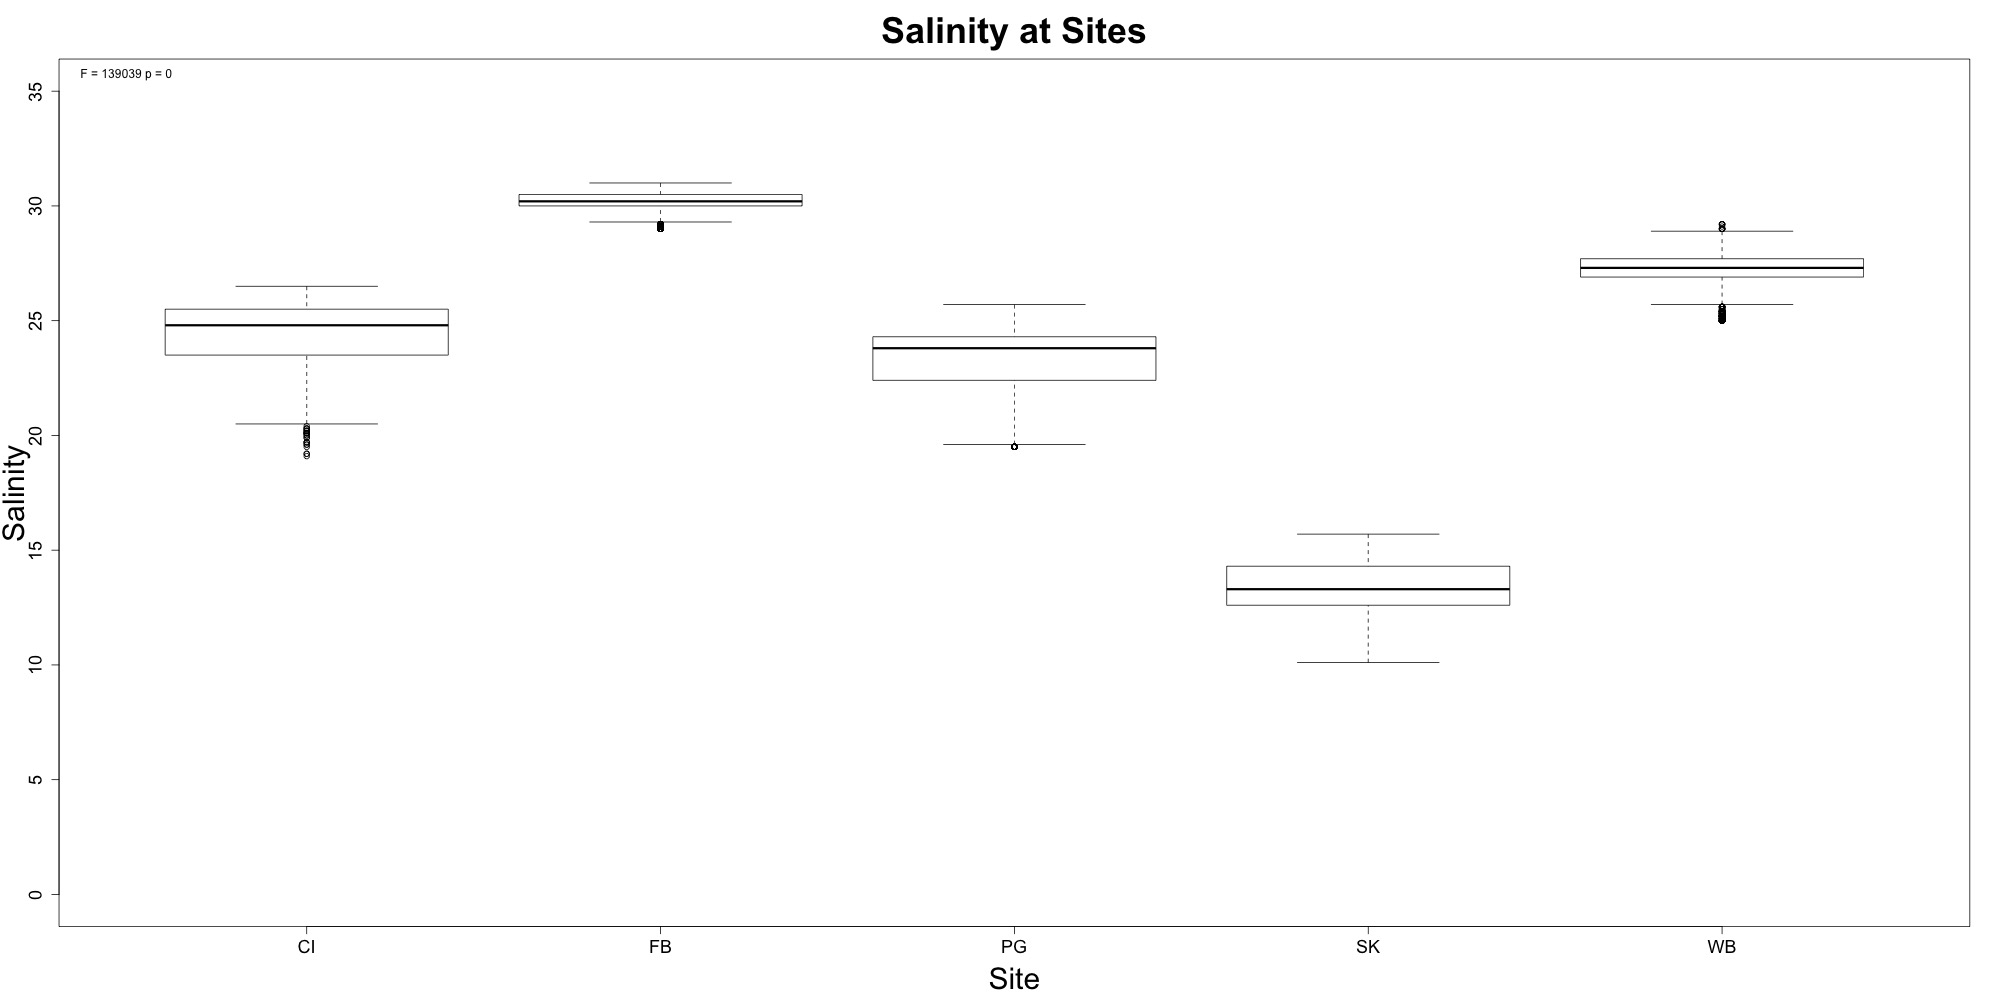
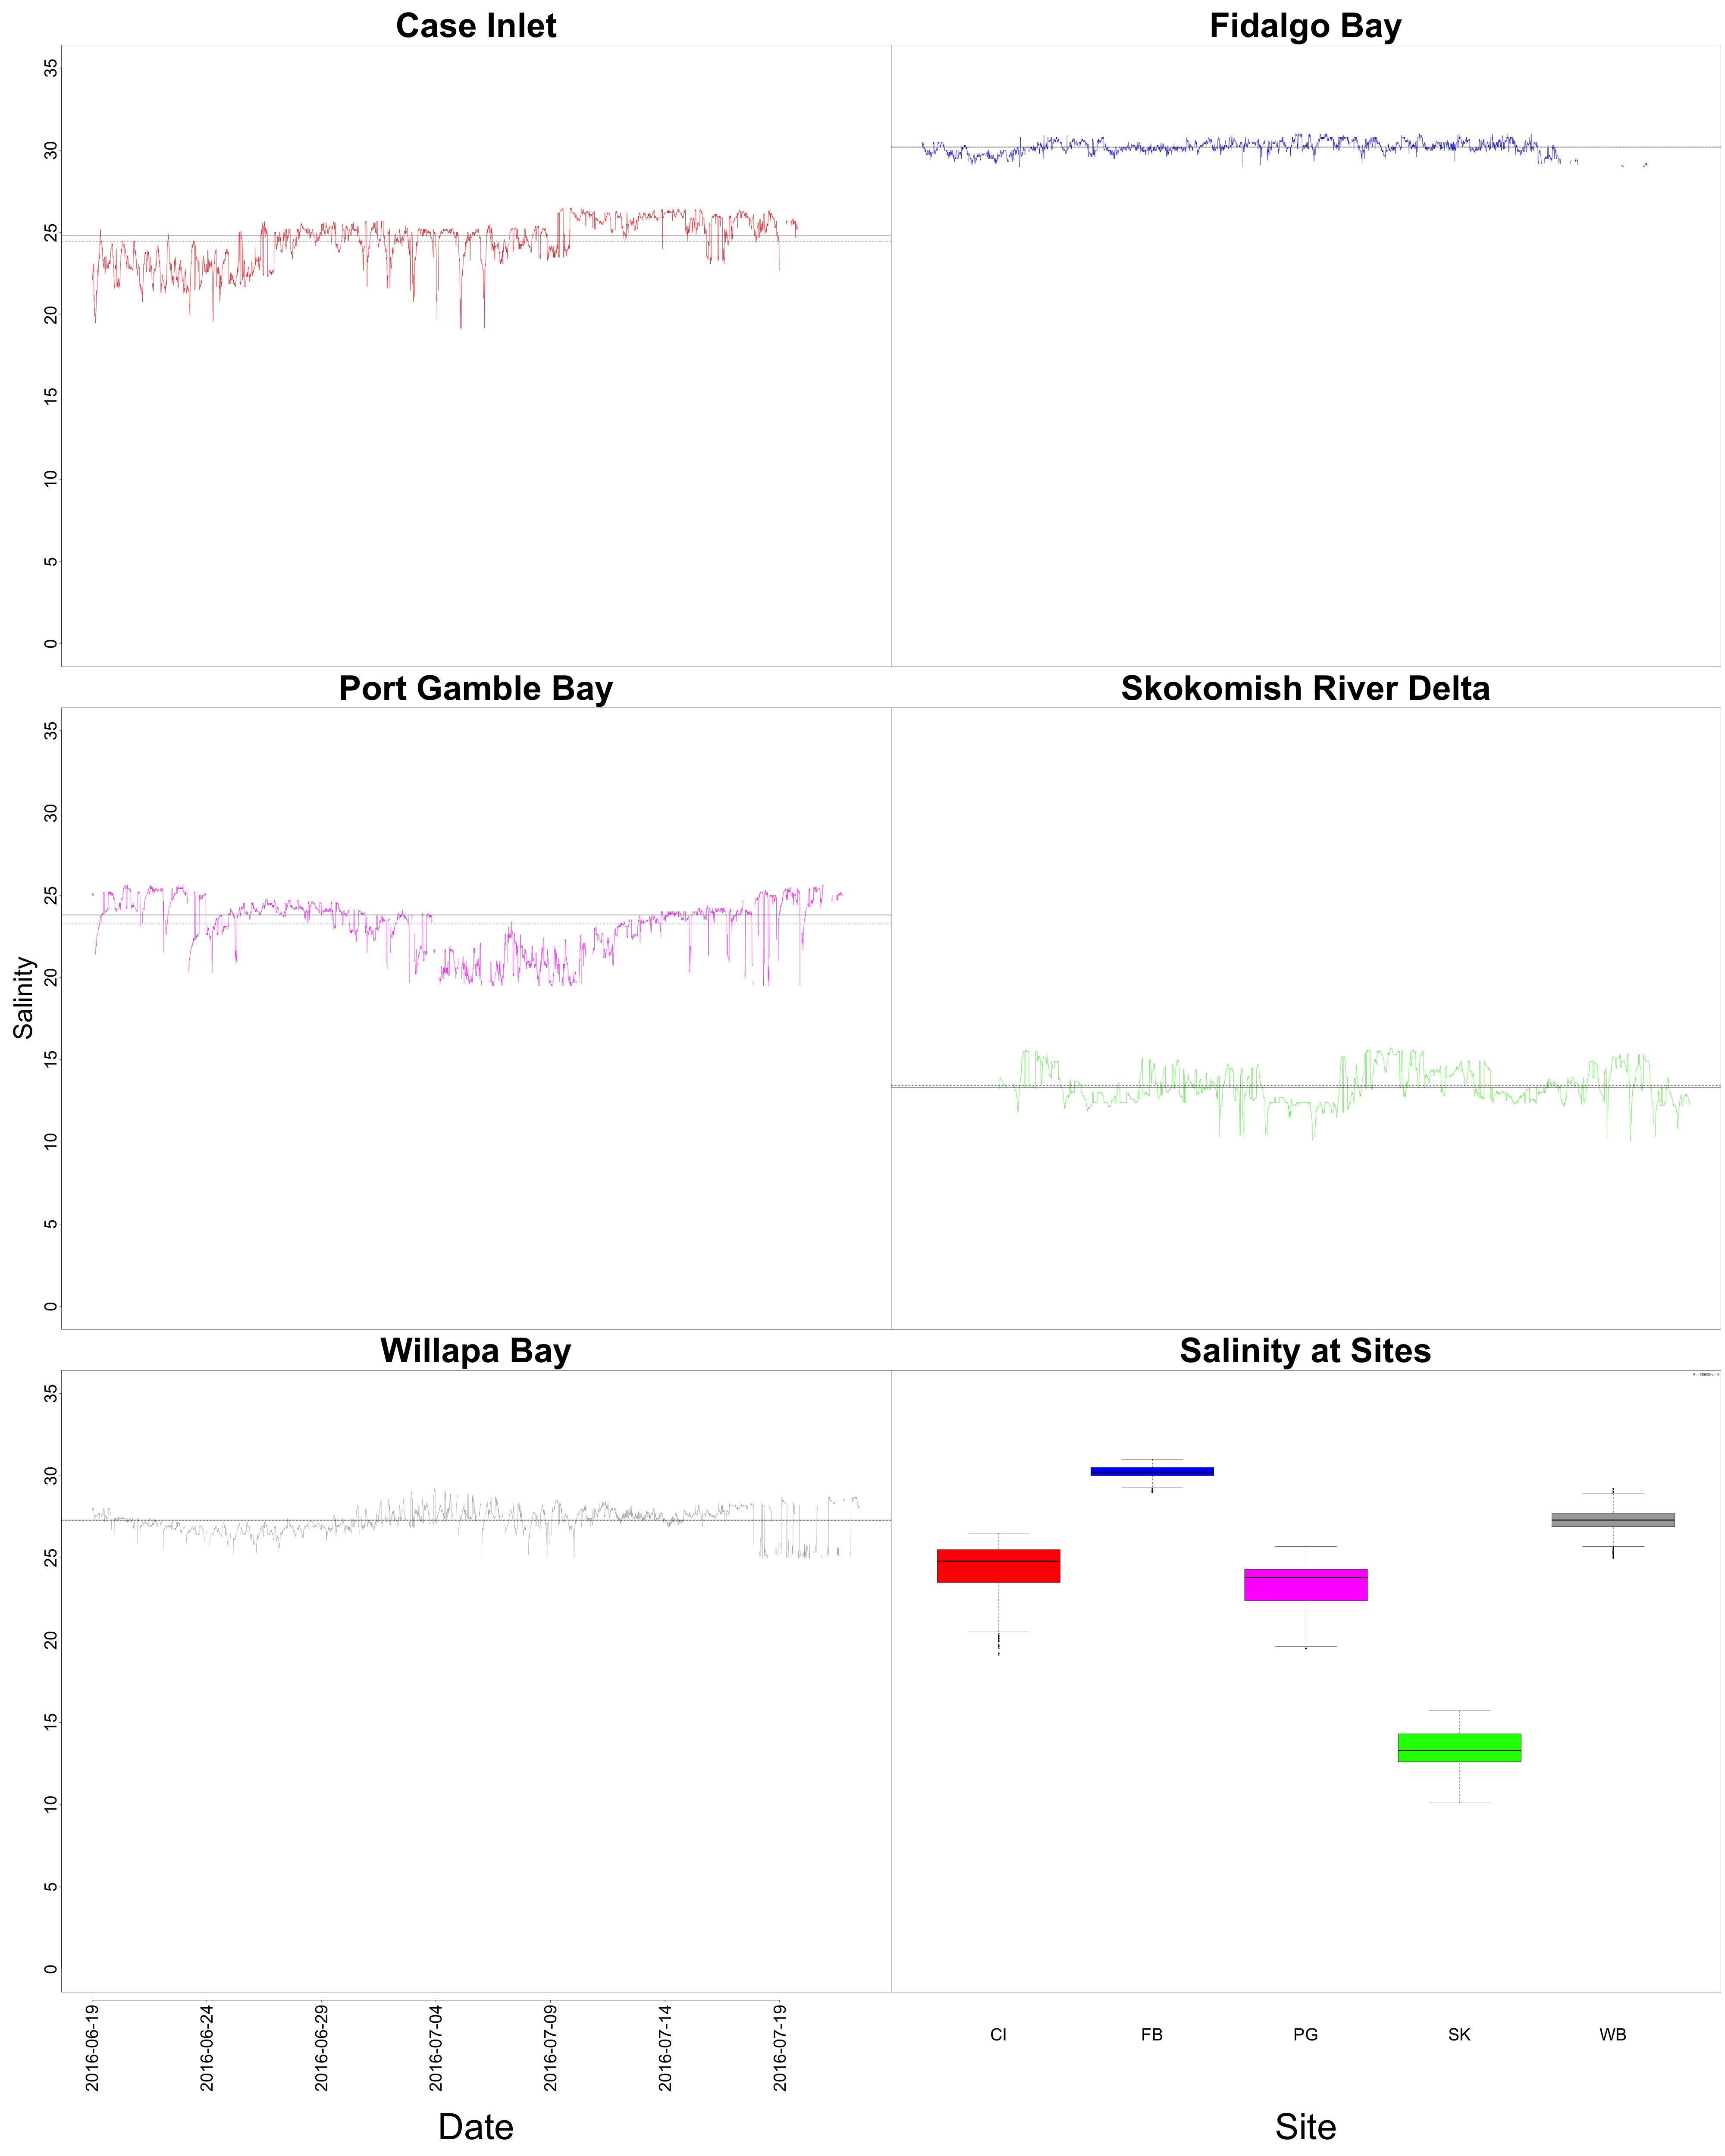
Figures 1-2. Boxplot and diurnal fluctuations of salinity during the outplant.
Alex and Micah were suspicious about the low salinity values, so at least I have correct data now. The sad part is that there’s no longer a salinity explanation for my data! I’m going to rework my discussion to focus a bit more on temperature. Then, I’m going to do a preliminary analysis of the NANOOS chlorophyll data. Woot.