
Remaining Analyses Part 7
Column comparisons
Emma ran two of my samples to see if she could “replicate my poor technical replication.” Instead, she ended up with good technical replication. The oyster samples are closer to themselves rather than the other oyster. There still seems to be quite a distance between the two technical replicates in ordination space though, but I guess that doesn’t matter (or could be due to the fact that she didn’t normalize the data).
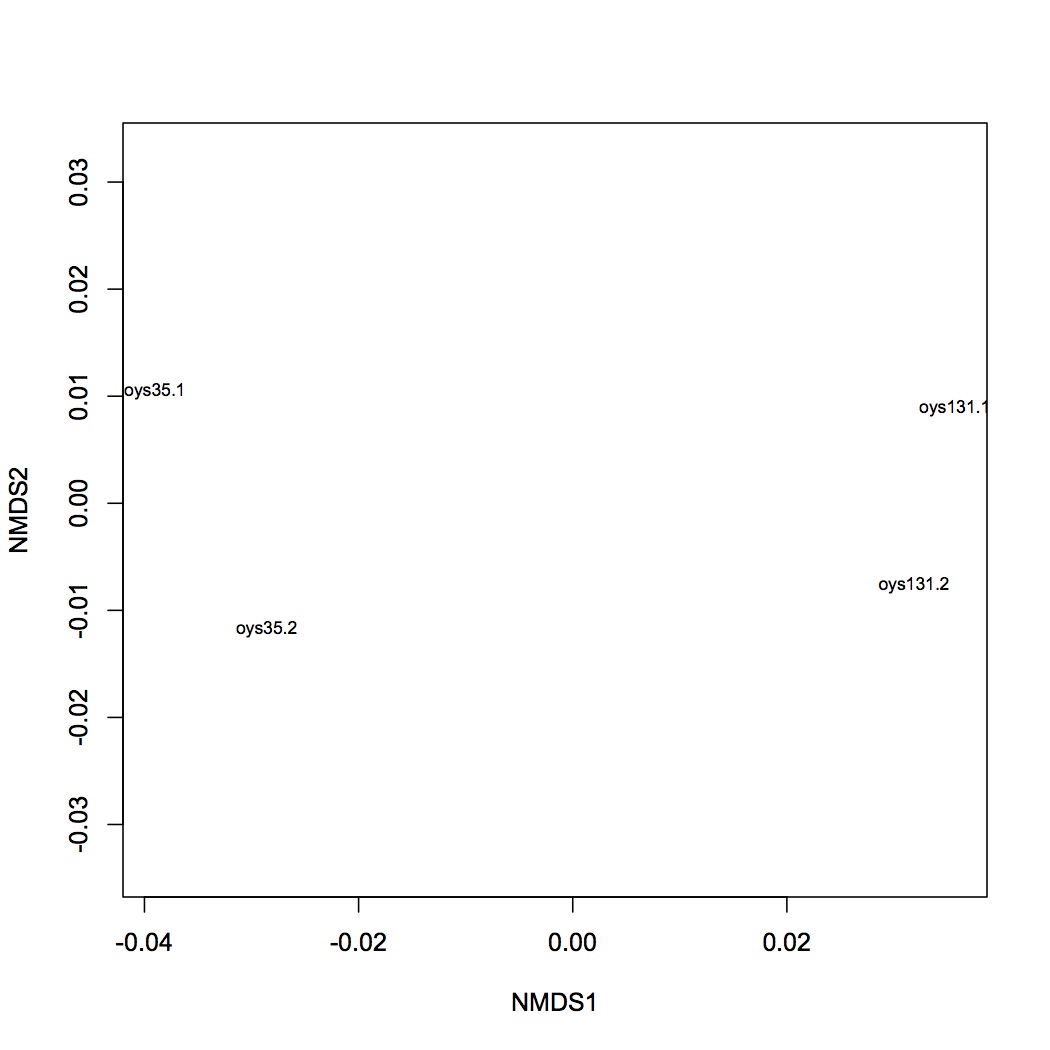
Figure 1. Technical replication from Emma rerunning my samples.
She also provided us the Skyline output. I could use this to compare the area data with the area data from my run.
Emma suggested that I calculate predicted retention times by column. For the first column, I used PRTC retention times from oyster sample 4. My regression equation was 0.2734x + 11.52. I used this equation to predict retention times for my oyster peptides.
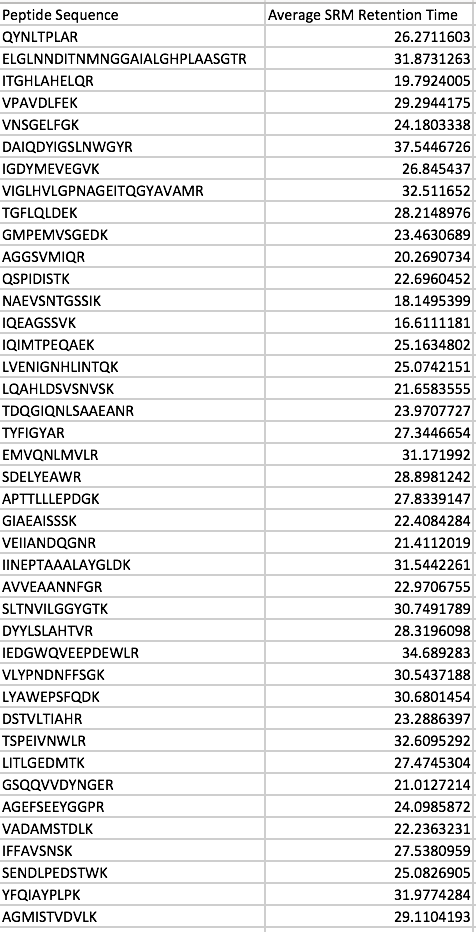
Figure 2. Predicted retention times for oyster peptides based on column 1 equation.
Using PRTC retention times from oyster sample 94, I got an equation of 0.2718 + 10.939 for column two.

Figure 3. Predicted retention times for oyster peptides based on column 2 equation.
There’s a slight difference in retention time from column 1 to 2, but not enough to where I would have picked the wrong peak. So now I’m really stumped and have no idea why my technical replication wasn’t good.
Emma also suggested I find PRTC peptides where I’m confident in the concentrations and try and compare peak areas between column 1 and 2. Based on screenshots from this lab notebook entry, my PRTC peptides had relatively similar peak area magnitudes at the end of the first column and beginning of the second column (around samples 85-95).
So yeah, I’m stumped.