
SRM Analysis Part 2
…Everybody Everywhere
(i.e. Cleaning Round 2)
Before I can normalize my data, I need to check my dilution curve. The reason we make a dilution curve is to confirm that as the concentration of protein in my sample decreases, there is a concurrent decrease in abundance picked up by the mass spectrometer. If this isn’t the case, then there’s something funky with the assay!
The first thing I did was duplicate the dilution curve Skyline file that was on Woodpecker so I could modify it. Laura made this document with both of our sample files. I then deleted all of the geoduck protein information and sample files.

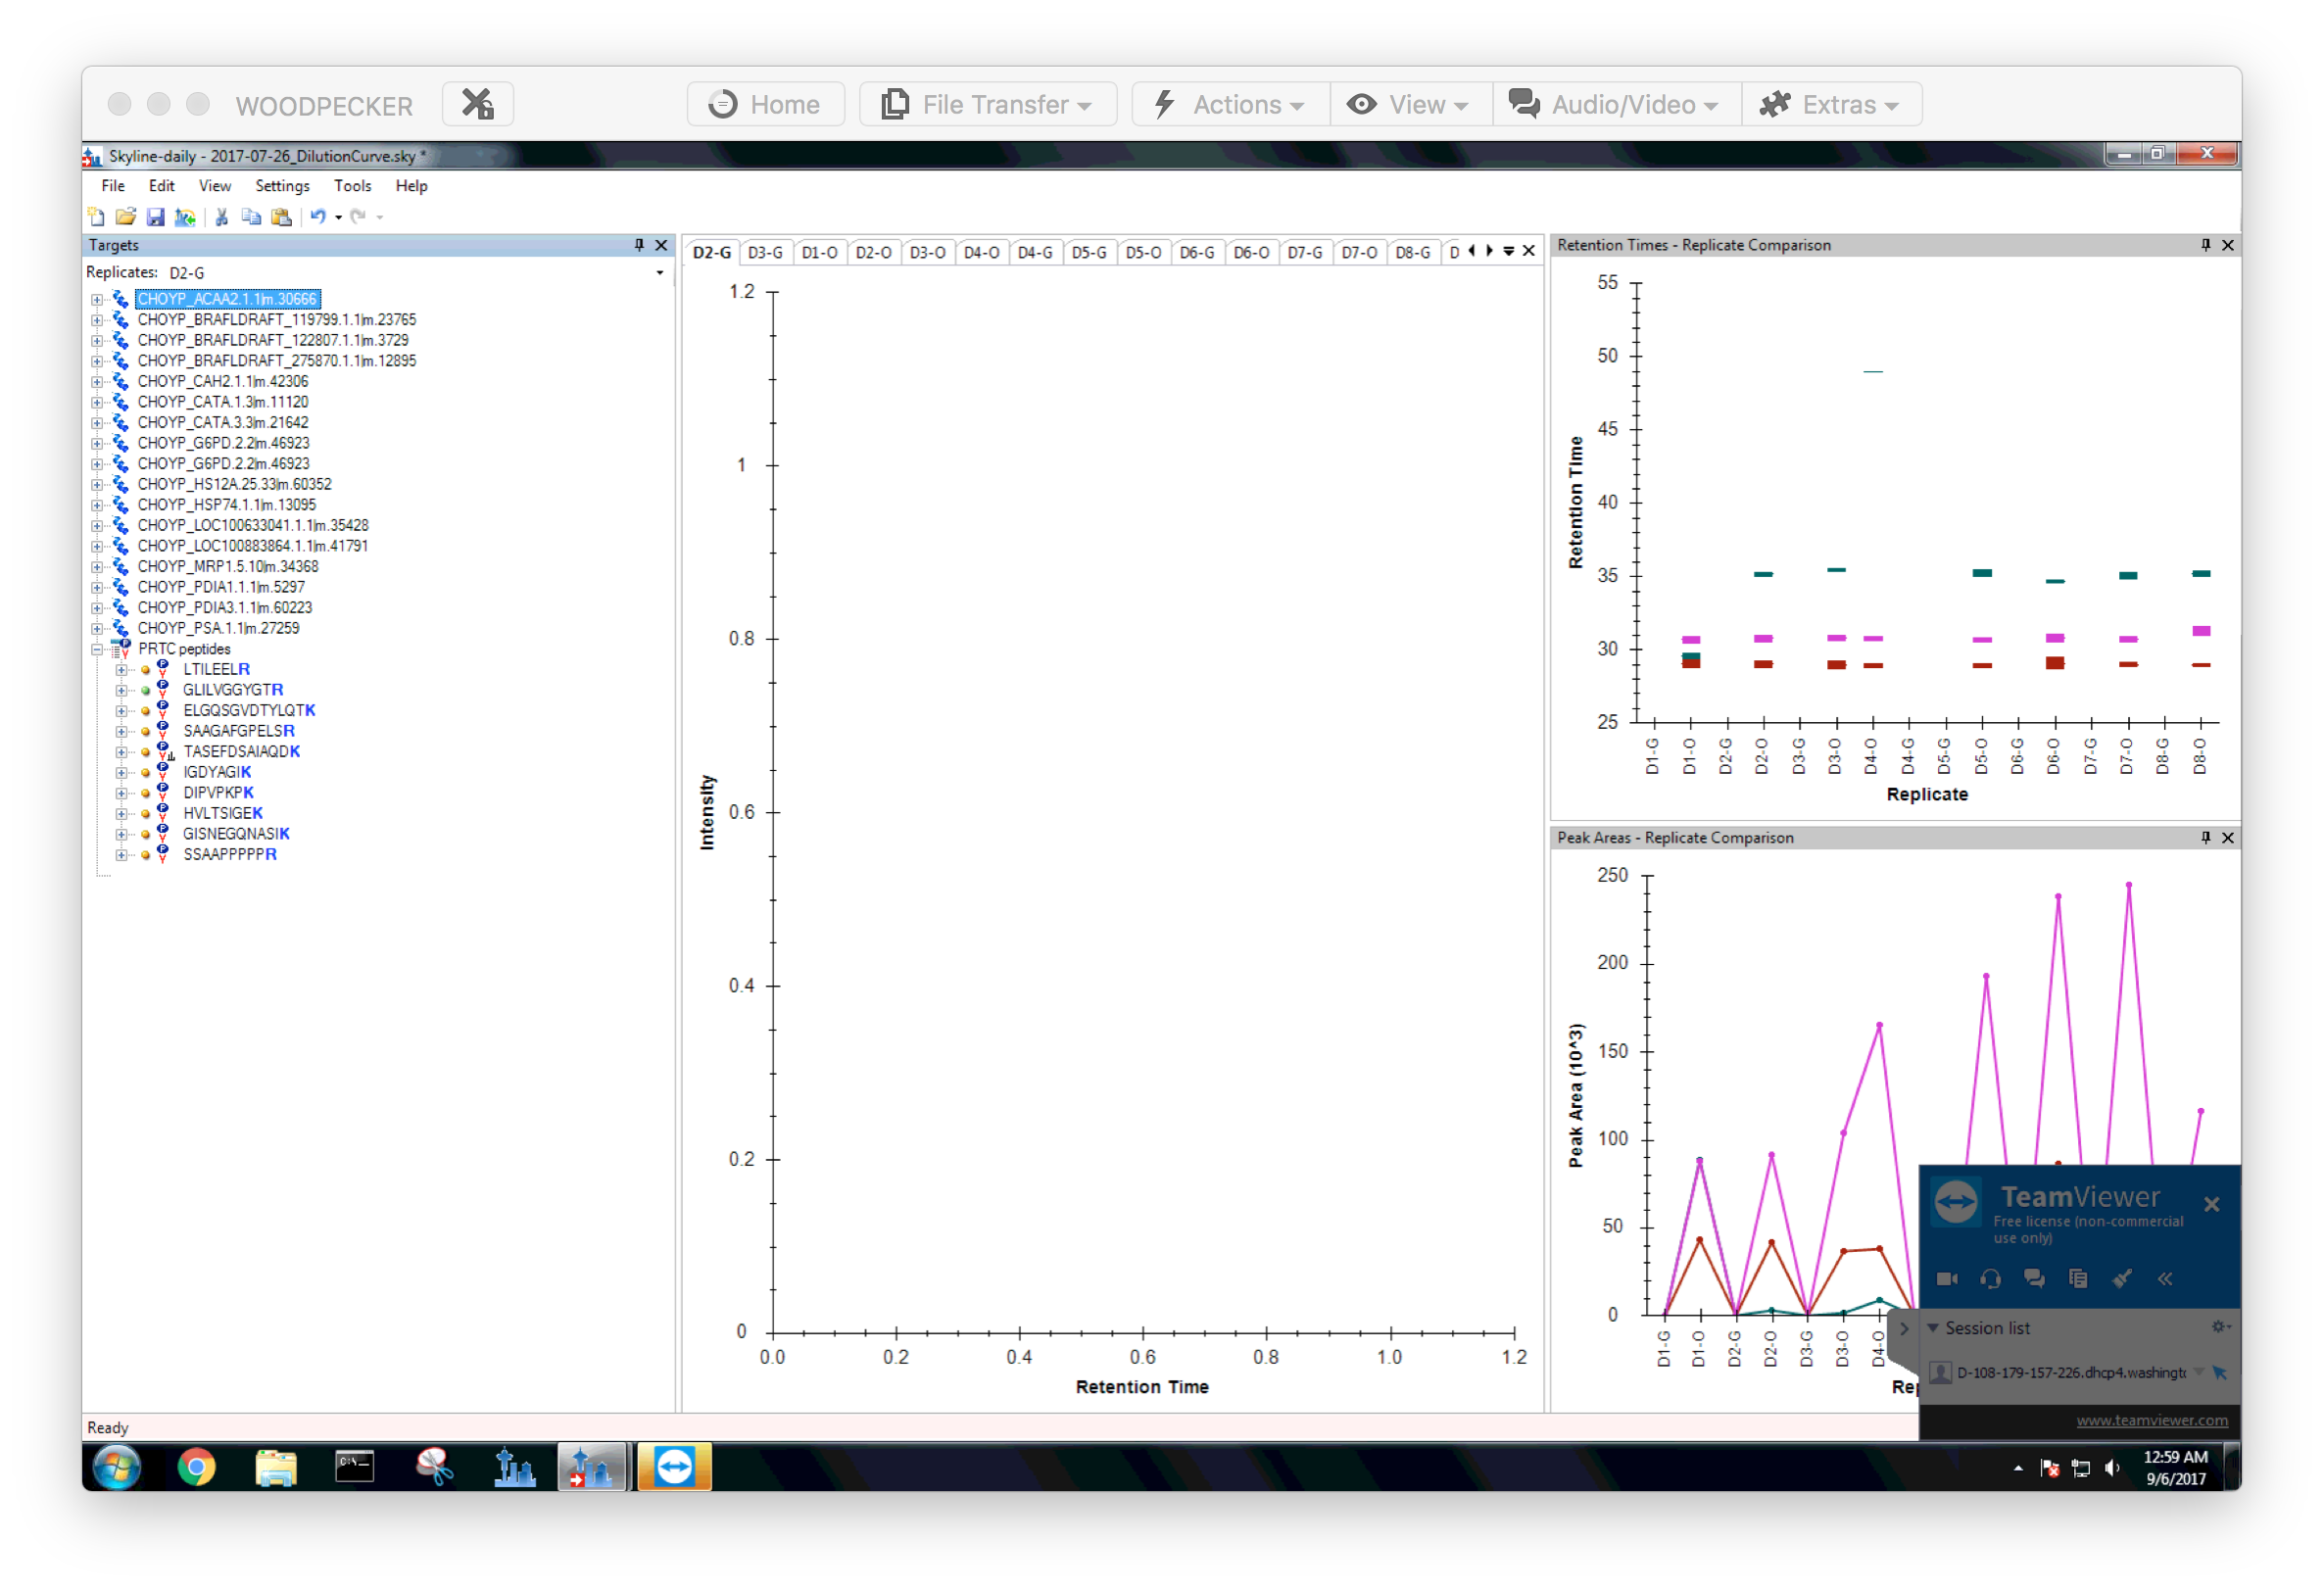

Figures 1-3. Creation of new Skyline document for oyster dilution curve
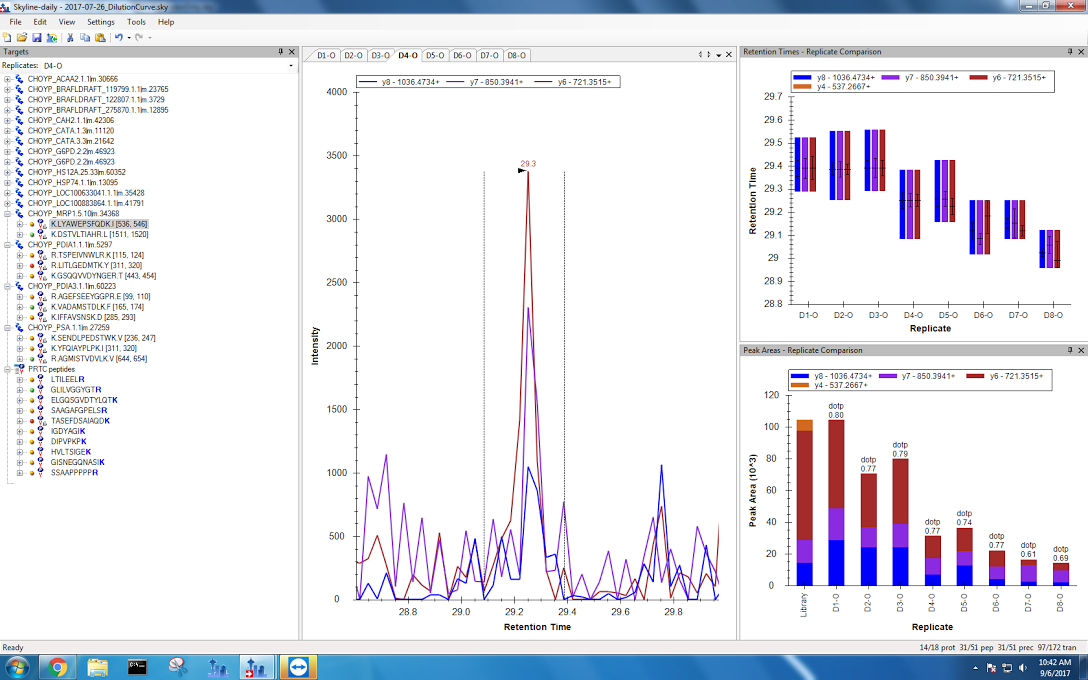
To select the correct peak, I looked at the retention time for the last sample I ran, file 132. Using that retention time, I found the correct peak. Because the diultions were run after Laura’s samples, the peptides had earlier retention times than sample 132. As usual, Skyline had some trouble selecting the correct peak even after I used “Apply All.” For each peptide, I made sure the correct peak was picked and adjusted the peak boundaries. Some peptides had really clean decreases in abundances. Others, like the one below, had a general decrease in abundance, with a slight increase in abundance in the middle. Since these peptides followed the overall pattern set by the dilution, I’ll keep them for analysis.

Figure 4. Example of a general decrease in abundance due to dilutions.
For dilutions 6, 7 and 8, the concentration of oyster proteins were really small. It was difficult to distinguish the peak in Skyline, so I did my best to pick the correct peak based on retention time. I also had to keep in mind that all of my peptides had a slight increase in retention time for the seventh dilution.

Figure 5. Example of a peak that’s difficult to pick out due to low abundance.
Sloppy peaks were a big problem for my multidrug resistant protein data from the fourth dilution onwards! Again, I tried my best to pick the correct peaks. If Emma thinks this is too messy to be reliable when I meed with her tomorrow, I can just exclude this protein from my analysis.


Figures 6-10. Multidrug ressitant protein data
Unfortunately, there were a few peptides that increased in abundance as the amount of oyster protein added decreased. This could mean a few things. Most likely, the assay was not correctly designed for these proteins. However, there’s also the possibility that there is a geoduck protein that is very similar to my oyster protein confounding the results. Since the total concentration of protein added was the same for all dilutions, a combination of oyster and geoduck protein detected should lead to the same peak area across dilutions. Therefore, I don’t think it was this second scenario, and that the assay was incorrectly designed.


Figures 11-13. Peptides that increase in concentration when they should be more dilute. I originally deleted them from my dilution curve document, but undid the deletion to save the dilution information.
I was iffy about the multidrug resistant protein, but decided to keep it since peptide abundances decreased as I added less oyster protein.

Figure 14. Dilution curve data for multidrug resistant protein, showing a general trend of decreasing peptide abundance.
I duplicated my Skyline document and deleted these peptides from my data before proceeding with my analysis. There were two peptides in proteins with three peptides that had increasing concentrations, so I think I can keep the proteins. Both peptides from HSP74 increased in concentration, so I deleted the protein entirely.


Figures 15-17. Peptides deleted from Skyline document with SRM replicate data.
Finally, I re-exported my data. This time, I added total ion current as well. I have two versions: one with pivoting the replicate, and one without.


Figures 18-19. Export settings for corrected data.
In hindsight, I probably should have done this before my initial data cleaning, but oh well.
Tomorrow, Laura and I are meeting with Emma to go over our PRTC abundances. When I emailed her about my loose batch effects and sloppy peptides, she suggested the following:
I think the best option at this point is to use PRTC peptides to predict RT and normalize data by TIC. I still think you and Laura should make sure your assay peptides are not similarly affected to rule out differences in abundance due to the mass spec.
Definitely choose the peaks that most closely match your predicted RT.
Hopefully tomorrow I have a solution so I can move forward!