
SRM Assay Day 2
Our assay works!
How do we know this? We checked, obviously. When Emma opened some of the newly generated data in Skyline yesterday, she noticed that Skyline wasn’t picking the best peaks. To ensure that 1) the SRM assay picked up the peaks in our transition list and 2) Skyline could quantify those peaks, I calculated predicted SRM retention times for my targets.
SRM target confirmation
In this Excel file, I first regressed SRM retention times against DIA regression times for these PRTC peptides:
- LTILEELR
- ELGQSGVDTYLQTK
- SAAGAFGPELSR
- DIPVPKPK
- HVLTSIGEK
- SSAAPPPPPR
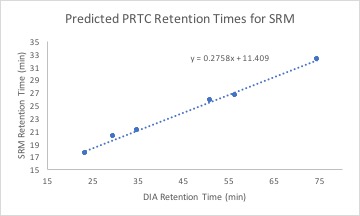
Using this equation and DIA retention times for my transition targets, I calculated predicted SRM retention times. My data can be found here.
In Skyline, I went through each peptide in two of my newly-collected oyster samples to ensure that Skyline picked the right peak. While the peaks were present around their calculation retention time, Skyline did not pick that peak for all but a few peptides.
For example, Skyline chose a peak at 34.4 min for this peptide, when the best peak is clearly around 28 minutes. The best peak matches the best retention time I calculated as well.

To fix this, I clicked on the peak I wanted Skyline to measure. Once I clicked on it, a black arrow appeared next to it.

I then right-clicked and selected “Apply Peak to All”, which had Skyline select the best peak for all samples in the document. Below, you can see that both samples have peaks made of three coeluting fragments around 28 minutes.

I went through this process for all of my peaks. While Skyline may not be fully capable of picking the best peaks, the peaks were present! This is confirmation that the SRM assay works.
New sample preparation
Using the PRTC I had leftover from yesterday, I prepared more samples to run on the mass spectrometer. I added PRTC to the first 11 samples on Plate 2. After the PRTC addition, Emma realized that the PRTC I had been using was the stock solution, and not a dilution! So the concentration of PRTC I’ve been adding to my sample is much higher than I wanted. Additionally, we wanted our final volume of sample, PRTC and final solvent to be 15 µL, but I added more final solvent to all of my samples due to a calculation error (15 - 7.5 + 1.875 instead of 15 - 7.5 - 1.875). My final solution has a volume of 18.8 µL instead. This isn’t bad, but it’s good for us to know.
Mass spectrometer update
The SRM has been going quite well! I’ve been checking the machine every few hours. When I look at the progress, I go through the following checklist:
- Check injection pattern

Figure 1. Normal injection pattern on the mass spectrometer. The drop in pressure is related to an injection.
- Look at RAW files for newly finished samples
Almost all of my RAW files look good! The one file that didn’t have any data in it was O01. If its technical replicate also doesn’t have any data, then I will need to remake the sample.

Figure 2. RAW file for a good sample.

Figure 3. RAW file for sample O01.

Figure 4. Raw file for a blank.

Figure 5. Raw file for a PRTC QC sample.
- Add any QC RAW files to the PRTC QC Skyline file
- Emma set up a Skyline document so we can look at the retention time and peak quality of all quality control files. By looking at them right away, we’re watching the retention times shift and ensuring that the assay does not decrease detection quality.

Figure 6. PRTC peaks in Skyline. Notice how the retention time shifts each QC file.
- Add files to the queue
Things are going smoothly, but tomorrow I’ll need to either 1) add PRTC to my remaining samples and run them or 2) proceed with the second injection for the samples I’ve done so far, depending on whether or not the PRTC I ordered arrives at the lab.