
WGBS Analysis Part 14
Testing methylKit parameters
I was working on identifying DML in the Hawaii samples, but there was so much data that methylKit started to crash locally and on the R Studio server. On top of that, I ran into a vector memory issue. Sam and Steven suggested I run the script on mox. Before I ran the script, I needed a way to ensure my code ran with no errors (Steven tried and found an error so there went my little hope that I coded something without an error the first time around)! Since the Manchester dataset is only eight samples, I figured I’d try it out.
Aligning to new genome
But first…I aligned to the new genome! Since I did this previously for the Hawaii samples, I copied the script, saved it as a new file, then changed the directory paths to match the Manchester analysis directories on mox. The FASTQ files are still on mox, so I just moved the script to my login node and started it. It was in the queue for about 6 days while the Hawaii data finished, and now it’s running! When I checked on it, I realized it was aligning the Hawaii data, not the Manchester data…so I fixed the directories in this script and restarted the job. Hopefully I have all the methylKit stuff figured out before the alignments finish.
normalizeCoverage
I was unable to process the Hawaii samples when I needed to normalize coverage between samples and prevent over-sampling from one oyster during statistical testing. Based on the vector memory issue, my thought was that R had to “hold” data from 24 samples when normalizing coverage, which was too much to process at once. I started this R Markdown script to test my theory.
I ran the following code on the eight Manchester samples:
processedFilteredFilesCov5 <- methylKit::filterByCoverage(processedFiles,
                                                          lo.count = 5, lo.perc = NULL,
                                                          high.count = NULL, high.perc = 99.9) %>%
  methylKit::normalizeCoverage(.) #Filter coverage information for minimum 5x coverage, and remove PCR duplicates by excluding data in the 99.9th percentile of coverage with hi.perc = 99.9. Normalize coverage between samples to avoid over-sampling reads from one sample during statistical testing
I was able to normalize samples without any issue! After updating this discussion post with my finding, I decided that I should process Hawaii samples with methylKit on mox to avoid running into any memory problems.
Global Methylation
Since I was able to normalize coverage for the Manchester samples, I thought I’d try debugging the rest of my script and get insight into this dataset. The first thing I did was understand global methylation patterns with the various graphing tools in methylKit. After normalizing coverage between samples, I created CpG methylation and coverage histograms (found here). Quickly thumbing through the files, I didn’t see any samples that were coverage of percent methylation outliers. I used unite to combine information from all samples, then I created a correlation plot, clustering diagram, and PCA to see if there were any treatment differences.
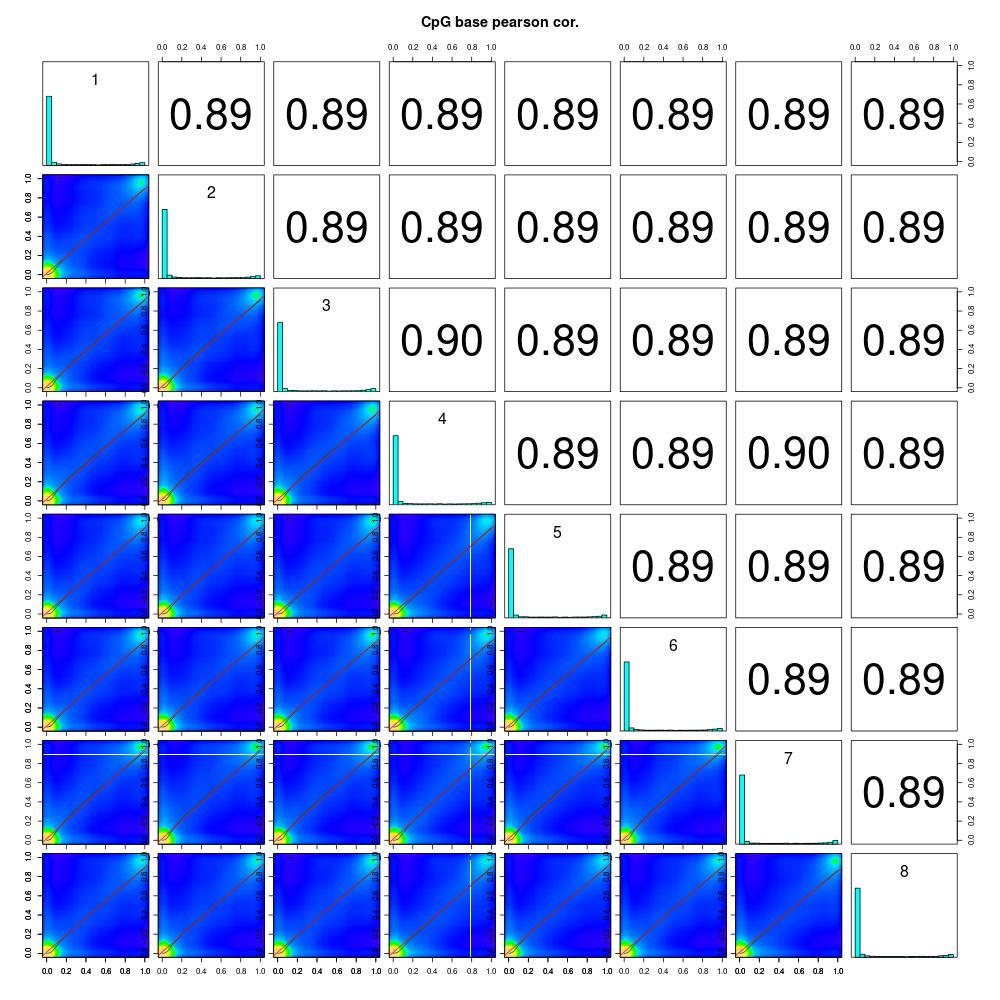
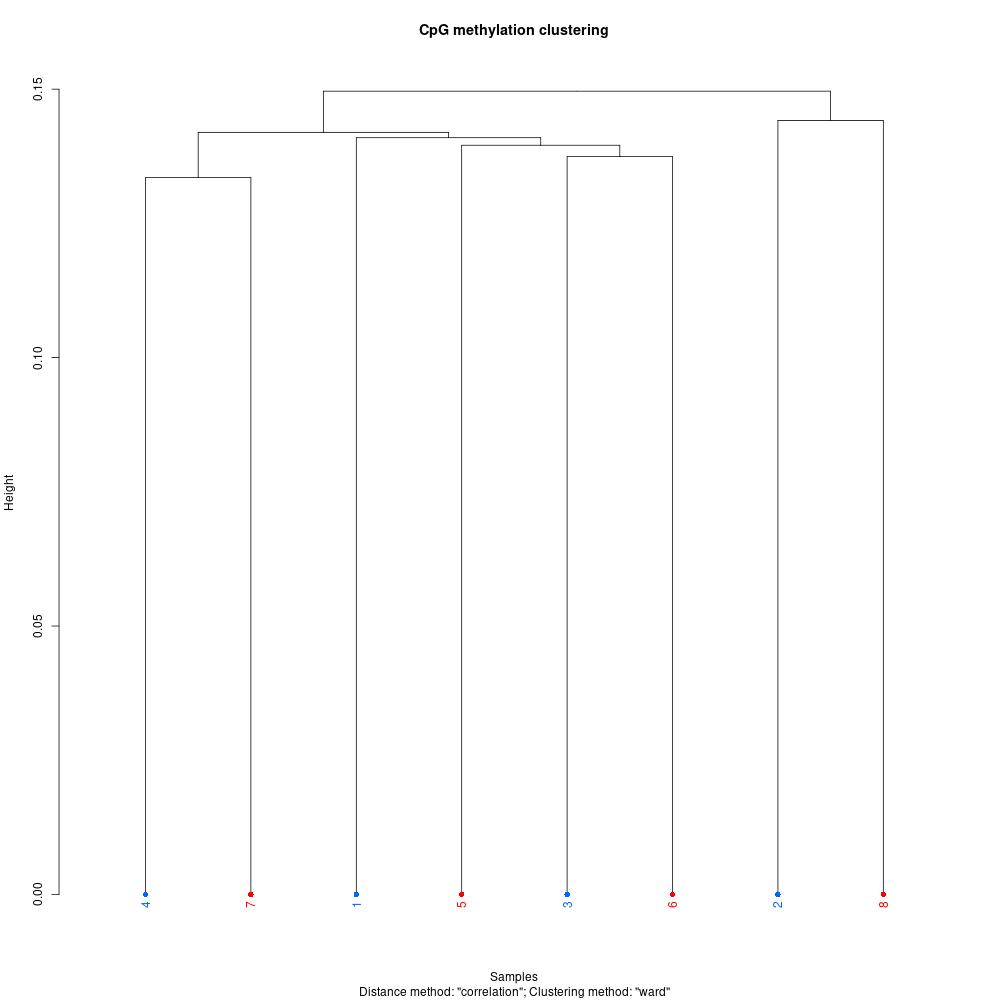
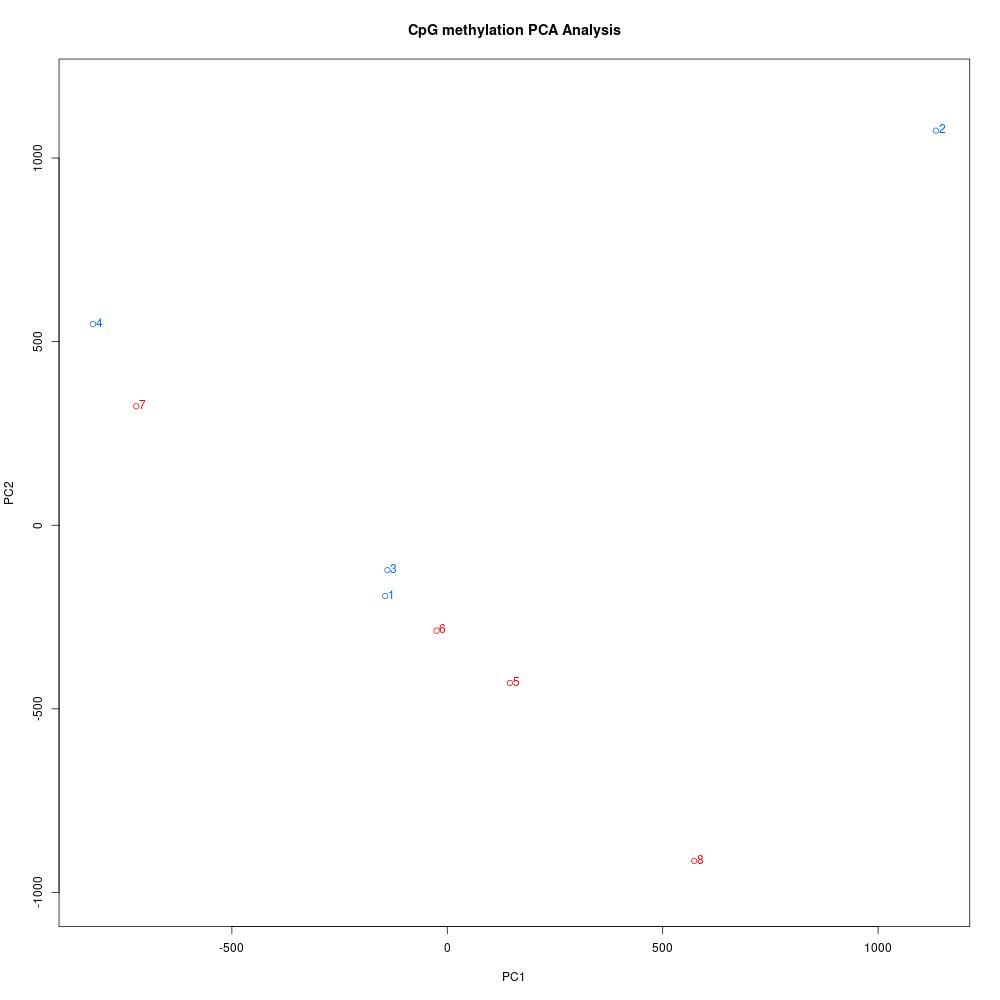
Figures 1-3. Correlation plot, clustering digram, and PCA for Manchester data. Samples 1-4 are low pH, samples 5-8 are control pH.
The clustering diagram didn’t reveal any clear sample differences, and the correlation plot showed that samples had low discordance. The samples seemed to separate based on treatment in the PCA, with the exception of samples 2 and 7.
Issues with calculateDiffMeth
The next step was to use calculateDiffMeth on the united dataset to quantify methylation differences by treatment in CpG loci with at least 5x coverage in all samples. I created a covariate matrix with sex and stage based on the histology processing information. At this point, I also realized that one sample from each treatment was an indeterminate oyster!! I thought I only had female oysters sequenced, but looking back through my notes I didn’t have enough DNA from only female samples. Once I finish testing some parameters, I think I’ll need to separate my analysis into two parts: 3 vs. 3 samples for low pH vs. control pH, and then 1 vs. 1 sample for the indeterminate oysters. This way, I can differentiate between treatment effects on oysters that are at the same(-ish) maturation stages. If any DML overlap, that may indicate a treatment effect that isn’t dependent on reproduction! Interestingly, sample 2 is an indeterminate sample, but sample 7 is not. Who knows what’s happening in that PCA.
Sidenote, here’s a screenshot of the Zymo report to remind me that samples 1-4 are low pH samples!

Figure 4. Zymo sample information
I decided to run the code from the methylKit handbook…
differentialMethylationStatsTreatment <- methylKit::calculateDiffMeth(methylationInformationFilteredCov5, covariates = covariateMetadata, overdispersion = "MN", test = "Chisq", mc.cores = 2). #test = "Chisq" is default
…and got this error:
Error in lm.fit(x, y, offset = offset, singular.ok = singular.ok, ...) :
  0 (non-NA) cases
My first thought was that I had too many covariates in my matrix, so I scaled down to just stage. Indeterminate oysters would be identified by stage anyways, and since I don’t have male oysters, I could get away with it. When I tried that code after modifying the covariate matrix, I still go the same error!
I found this issue on the methylKit Github repo in which the OP had a similar issue. The package creators suggested removing min.per.group from the unite command, but I didn’t use this argument! I posted this discussion to try and brainstorm what to do next. Sam suggested investigating the unite output to see if there were any NAs:

Since I didn’t have any with the input, I figured it was an issue with the modeling. My first thought was to run calculateDiffMeth without a covariate matrix. I ran the code without the covariate matrix and didn’t get an error, but R crashed!
differentialMethylationStatsTreatment <- methylKit::calculateDiffMeth(methylationInformationFilteredCov5, mc.cores = 4)
I then tried running it without any arguments:
differentialMethylationStatsTreatment <- methylKit::calculateDiffMeth(methylationInformationFilteredCov5)
I got an output dataframe from this command! Next, I tried adding on an overdispersion correction. Once an overdispersion correction is used, you have to specify the chi-squared test:
differentialMethylationStatsTreatment <- methylKit::calculateDiffMeth(methylationInformationFilteredCov5, overdispersion = "MN", test = "Chisq", mc.cores = 2) #Got an error :(
differentialMethylationStatsTreatment <- methylKit::calculateDiffMeth(methylationInformationFilteredCov5, overdispersion = "MN", test = "Chisq") #Got output!
Even with all the arguments, when I specified mc.cores I got an error! When I ran the code without mc.cores I was able to get an output methylDiff object:

So now I was pretty sure specifying mc.cores was an issue…which also sucks because not being able to use multiple cores to process a large model means that the command will take F O R E V E R.
I started running the following code, and will check it later to see if I get an output matrix!
differentialMethylationStatsTreatment <- methylKit::calculateDiffMeth(methylationInformationFilteredCov5, covariates = covariateMetadata, overdispersion = "MN", test = "Chisq")
Going forward
- Write methods
- Identify SNPs in WGBS data mapped to Roslin genome
- Revise
methylKitstudy design: separate tests for indeterminate and female oysters - Write results
- Determine if RNA should be extracted
- Determine if larval DNA/RNA should be extracted