
WGBS Analysis Part 36
Miscellaneous enrichment investigations
I have a two outstanding things I want to look at before I close the book on my enrichment analysis results.
Unannotated GOterms and potential nesting
When I was creating my annotation lists, I noticed that not all GOterms from topGO were present in the genome annotation I generated. I want to see if these terms were nested inside of other GOterms that were enriched, or if they were parent terms of other terms present in my annotation.
My biological process GOterms without matching annotations were GO:0001539 (cilium or flagellum-dependent cell motility), GO:0003341 (cilium movement), GO:0060285 (cilium dependent cell motility), GO:0060294 (cilium movement involved in cell motility), GO:0097722 (sperm motility), and GO:0001700 (embryonic development via the syncytial blastoderm). The terms GO:0002165 (instar larval or pupal development), GO:0009791 (post-embryonic development), and GO:0007391 (dorsal closure) had matching annotations for some transcripts but not others. I looked for parent and child terms on the QuickGO.
Several motility terms were related to eachother, including ones with and without annotations:

I encountered a similar situation looking at two GOterm lineages for developmental terms:

Most of the cellular component GOterms were missing matching annotations, and were all related to eachother:
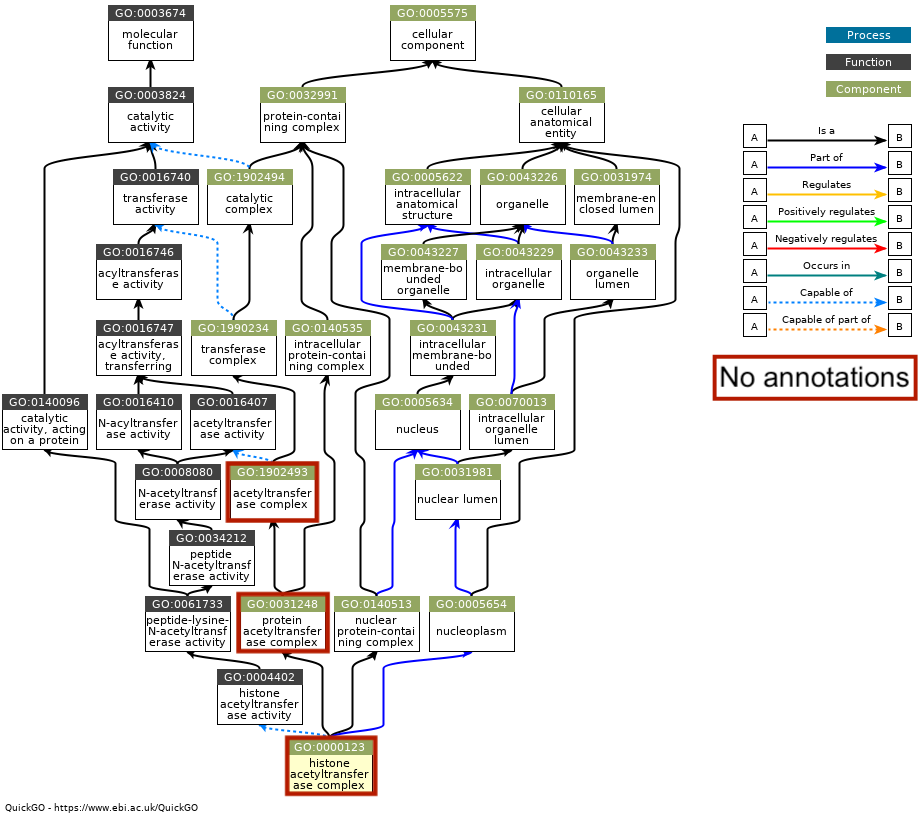
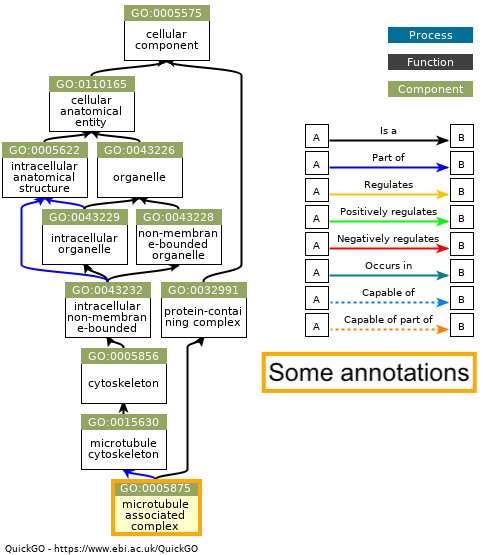
I had one cellular component term with some annotations, and it was not related to the other terms:
I’m not sure why some of the topGO GOterms show up in the annotation or not, but my guess is that topGO may consider the entire term “family tree” when performing enrichment in a way that’s different than the annotation.
Enrichment of hyper- vs. hypomethylated DML
I wanted to see if the genes with enriched GOterms contained more hyper- or hypomethylated DML. While we found a pretty even split of hyper- and hypomethylated DML, any differential enrichment of these DML may give us additional insight into the function of methylation. To do this, I took my dataframe with enriched GOterms and used it as a transcript index to filter my master DML list:
sigRes.allBPMethDiff <- unique(sigRes.allBPProduct %>%
  dplyr::select(., transcript) %>%
  left_join(., allDMLGOtermsFiltered, by = "transcript") %>%
  filter(., GOcat == "P") %>%
  dplyr::select(., geneID, chr, start, end, meth.diff)) #Isolate transcript column; join with DML list; remove all rows that aren't BP GOterms, select gene ID/chr/start/end/meth.diff columns
Based on my filtering, I identified 16 unique DML in genes with enriched BP GOterms. Of these 16 DML, 13 were hypermethylated and 3 were hypomethylated. When I did the same thing with my CC GOterms, six of the seven unique DML were hypermethylated. There is definitely an enrichment bias for genes with hypermethylated DML.
Going forward
- Update methods
- Update results
- Revise discussion
- Revise introduction
- Identify journals for submission
- Format for submission
- Submit preprint to bioRXiv
- Submit paper for publication
- Report
mc.coresissue tomethylKit - Perform randomization test
- Update
moxhandbook with R information - Determine if larval DNA/RNA should be extracted