Remaining Analyses Part 11
Connecting the dots
Overwhelmed with the amount of data I had to work with, I did what any #ResponsibleGradStudent would do: talk to my adviser. Steven and I decided that the two best things to do would be to visualize diurnal fluctuations and regress peptide abundances against biomarkers. For the environmental variables, I’m not going to clip out any low tide exposure unless we think there’s something interesting to pursue and refine.
Environmental variables
Temperature
This the variable that I for sure think could explain some differences in peptide abundance between sites.
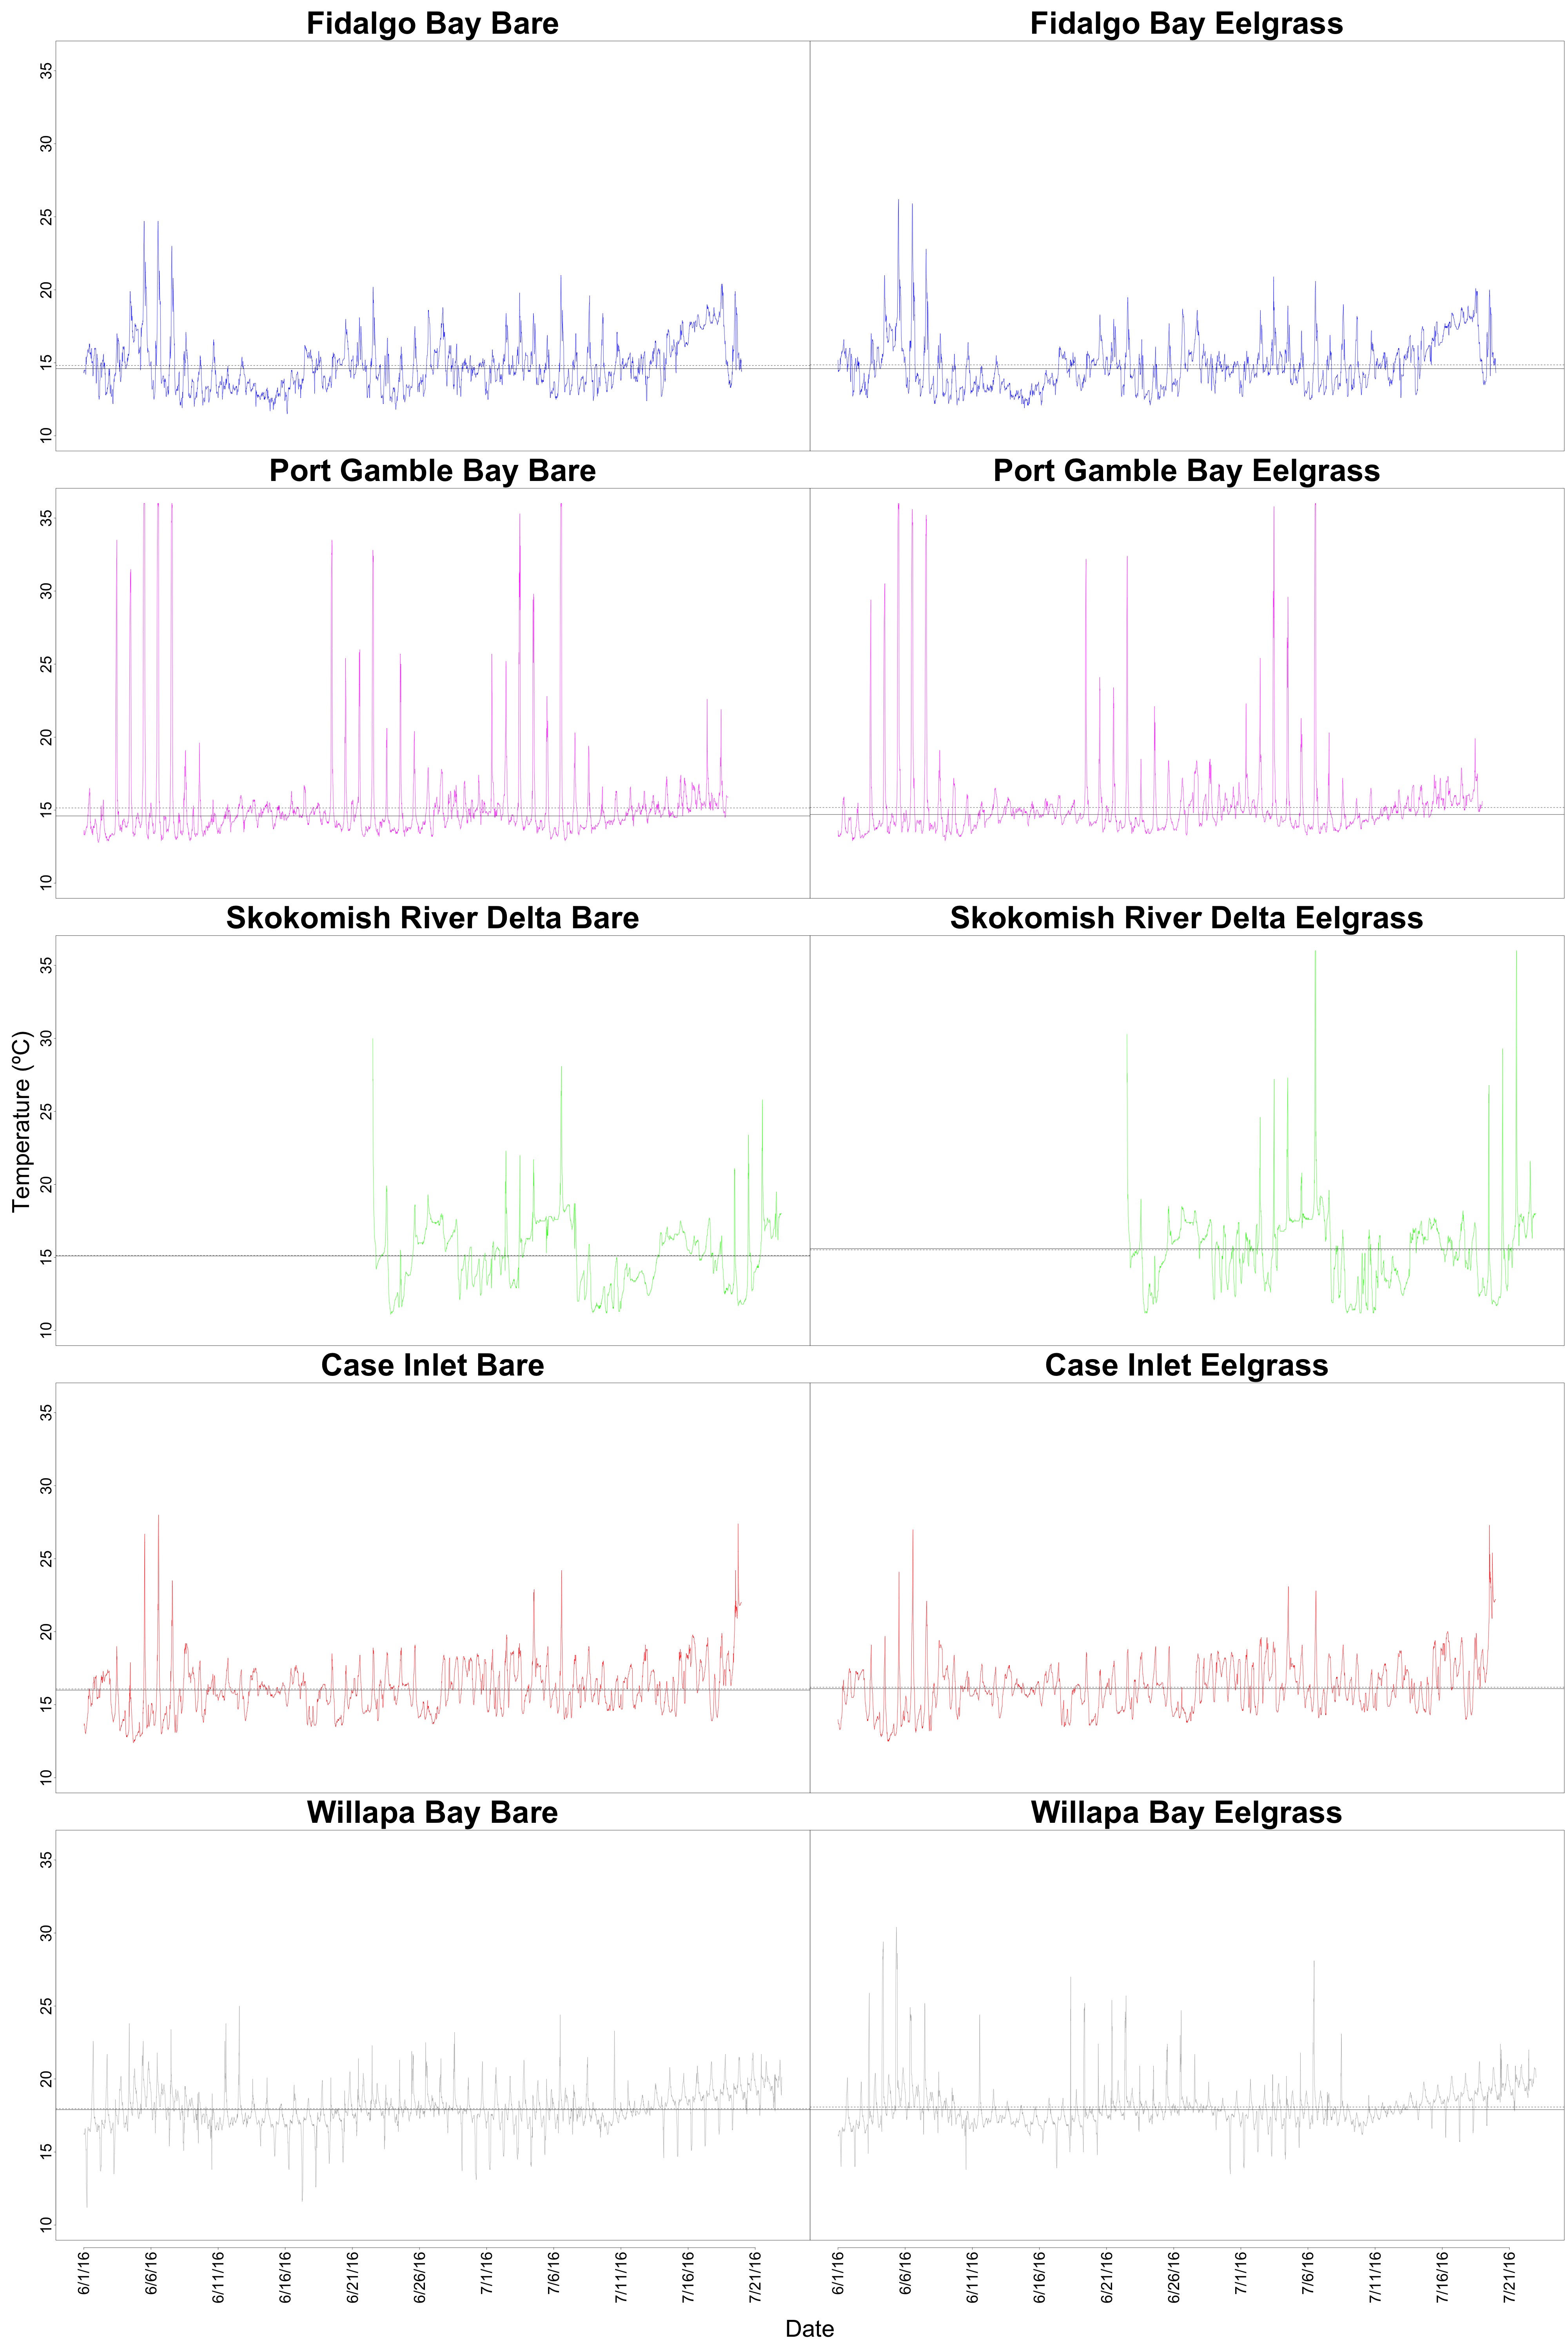
Figure 1. Diurnal fluctuation of temperature at each site.
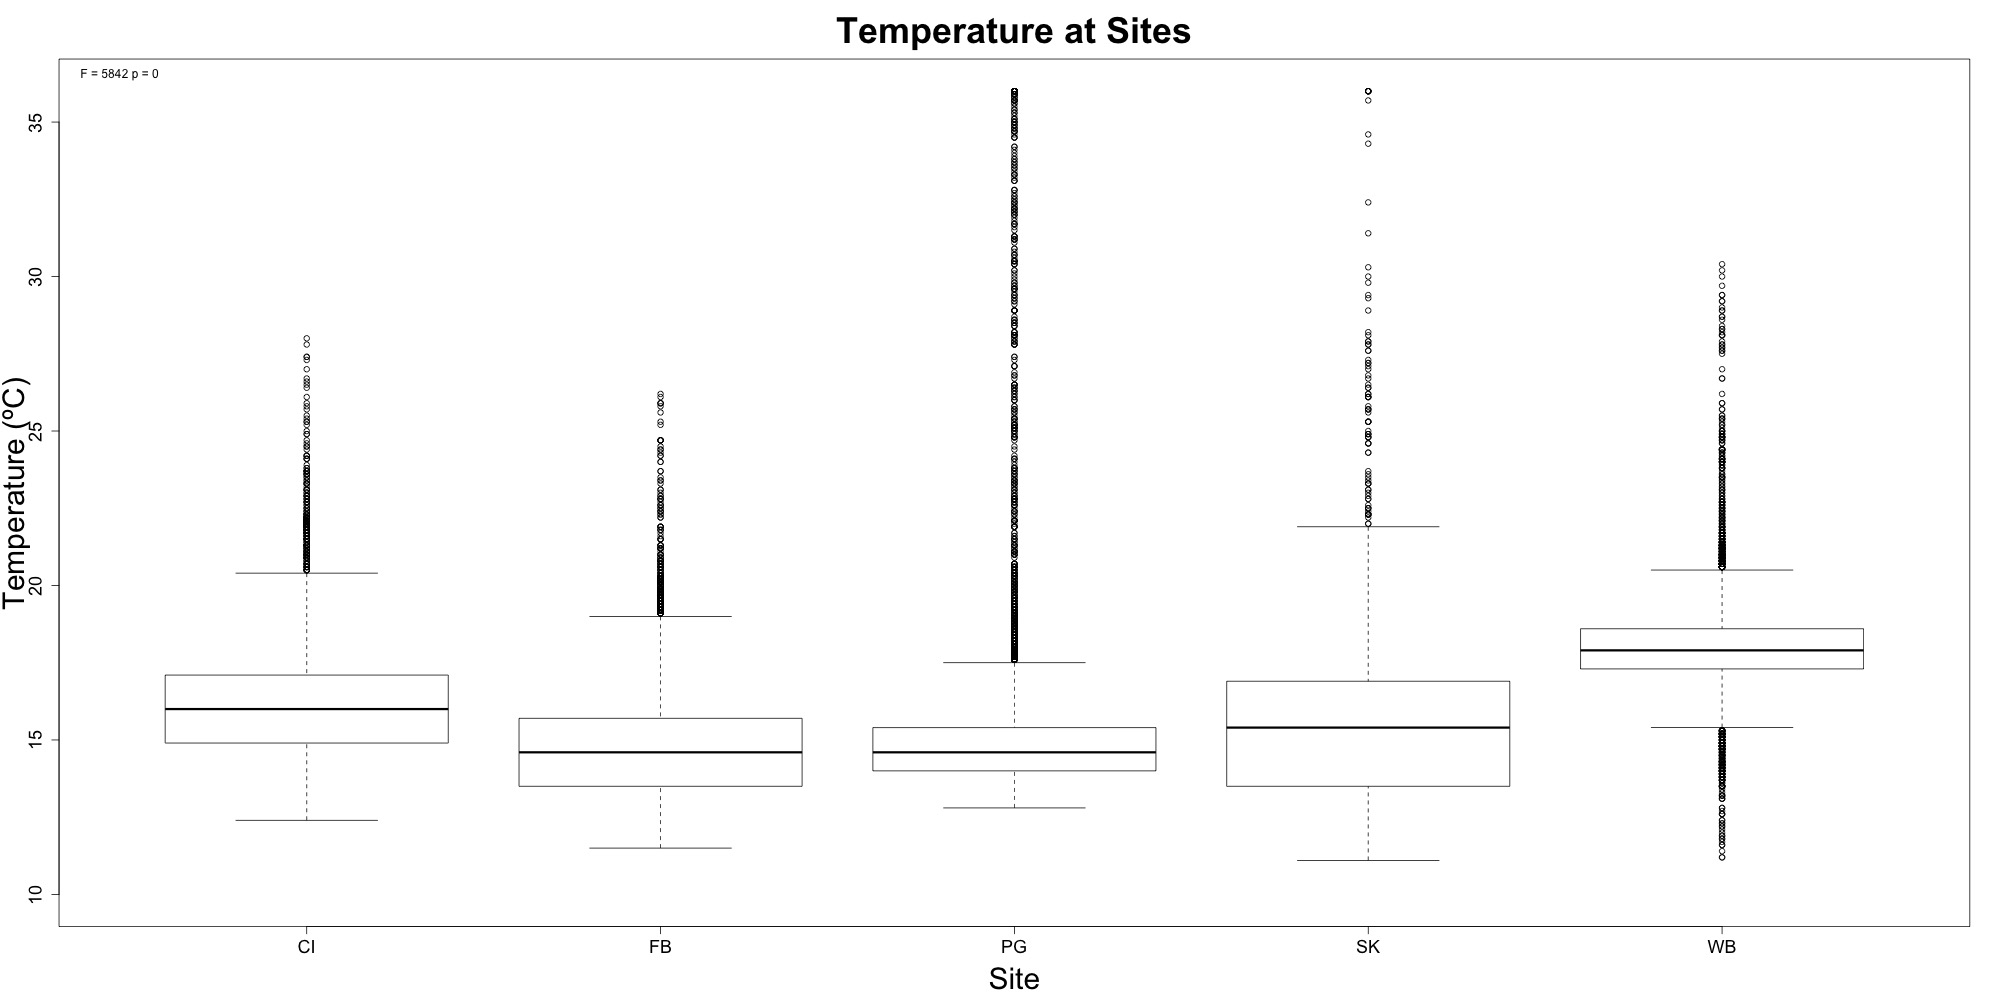
Figure 2. Differences in temperatures at each site.
Salinity
I was unable to clip out low exposure data, but like I mentioned above, I’m not going to clip it out unless something looks interesting. Aside from higher salinity at Fidalgo Bay (which could be an artifact of low tide exposure), I don’t see anything worth pursuing.
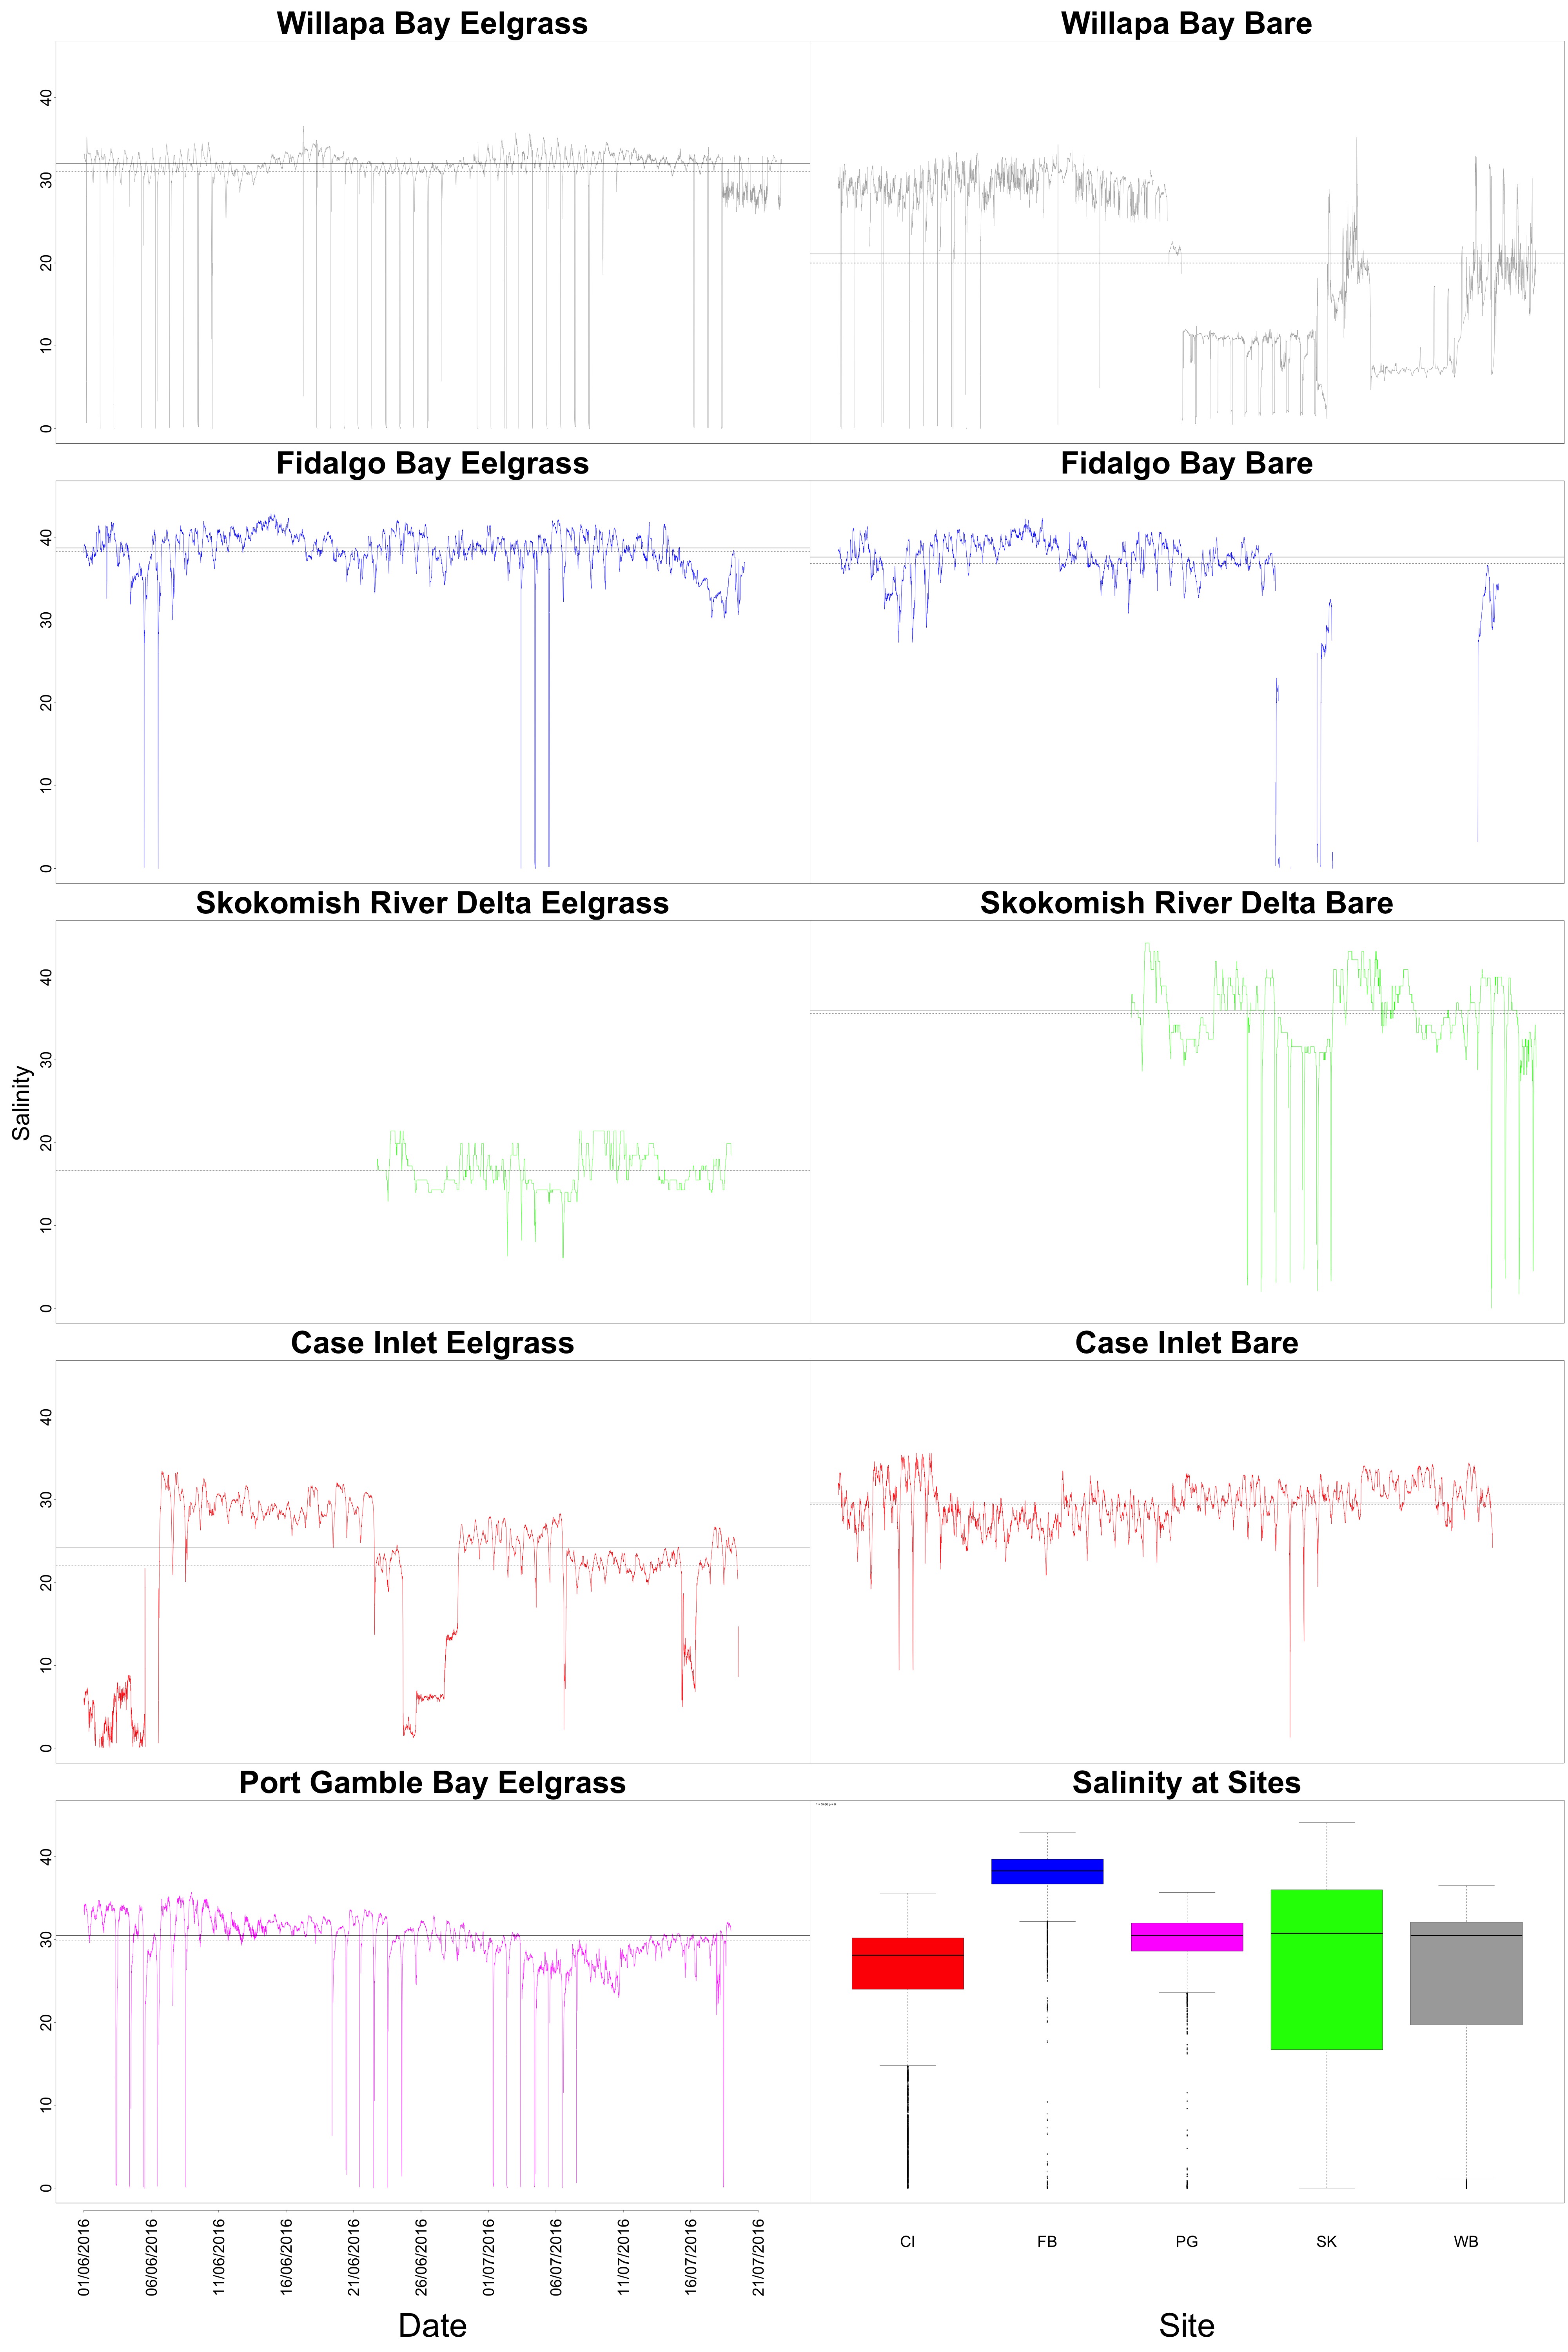
Figure 3. Diurnal fluctuation of salinity at each site.
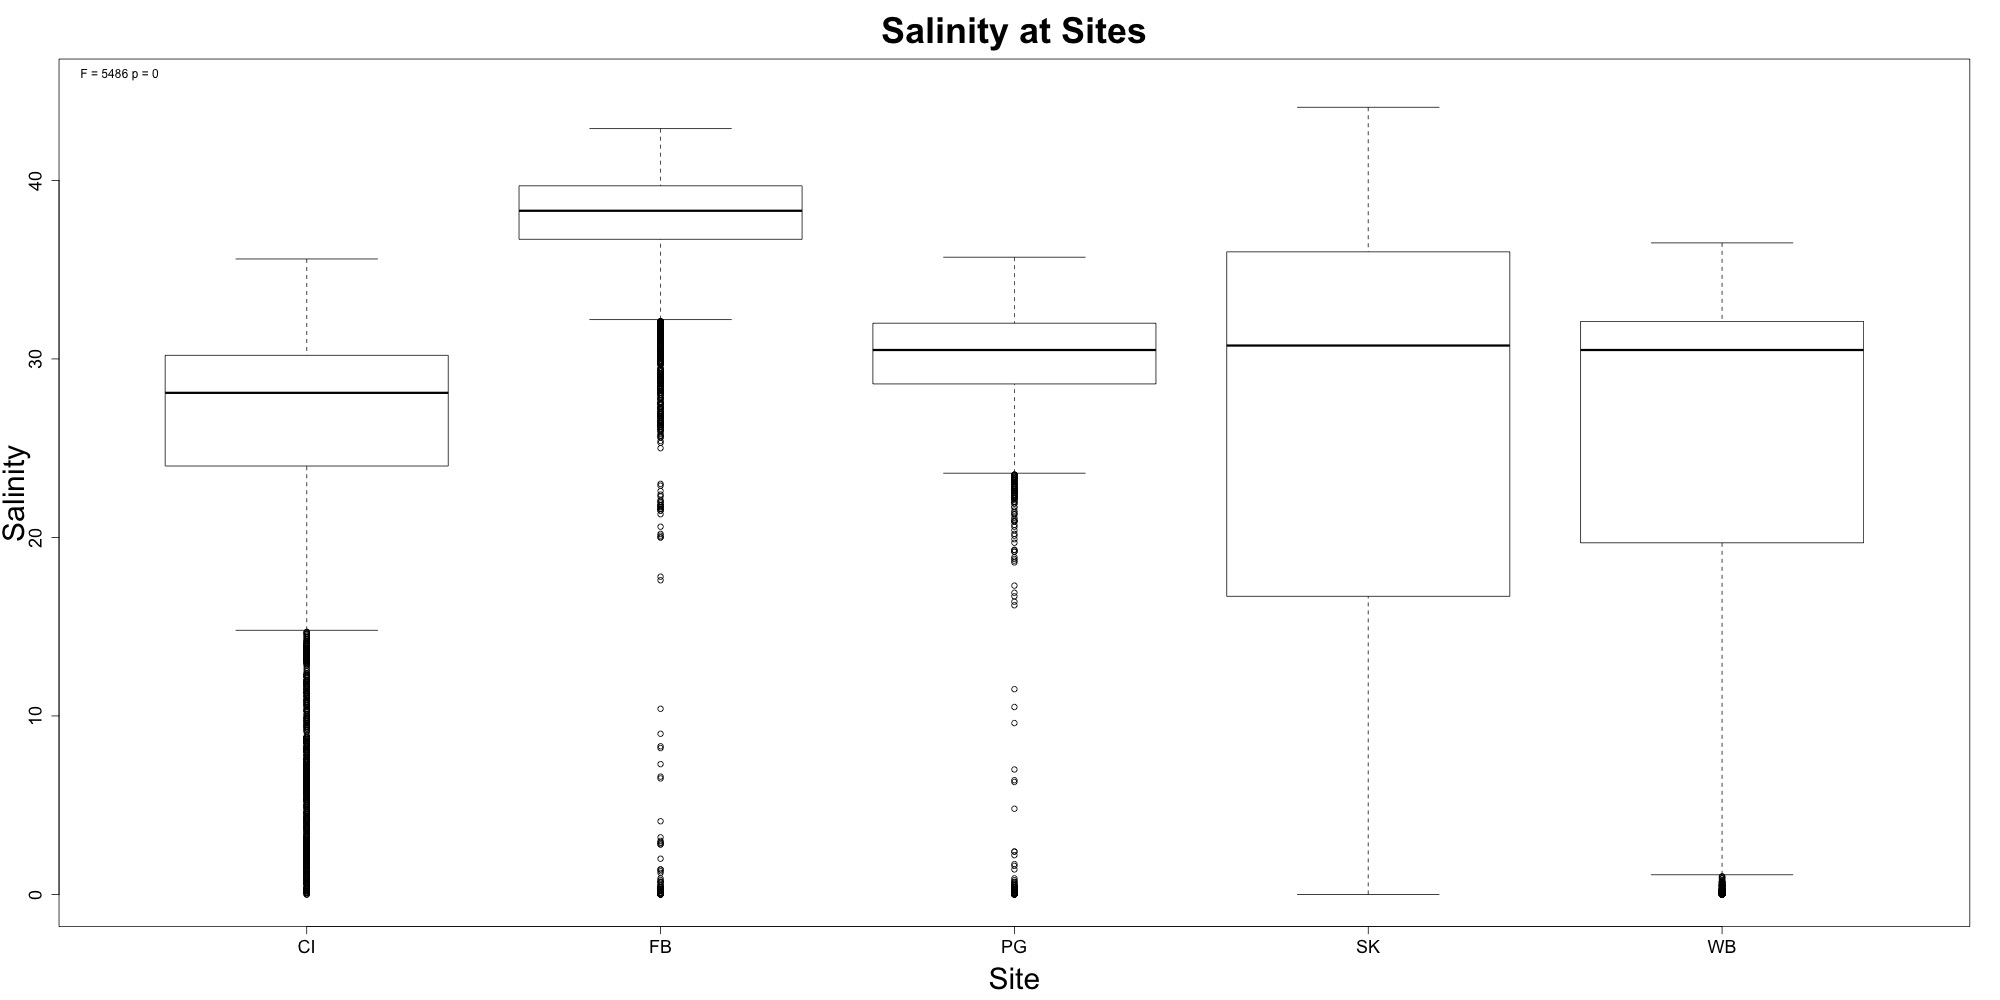
Figure 4. Differences in salinity at each site.
pH
Willapa Bay had higher pH than Port Gamble Bay and Skokomish River Delta, but not the other two sites. Unlike the other environmental variables, all of my sites were not significantly different from eachother. The significant differences are between Fidalgo Bay and Port Gamble Bay (0.0004023), Skokomish River Delta (0.0028254), and Willapa Bay (p = 0.0002764)
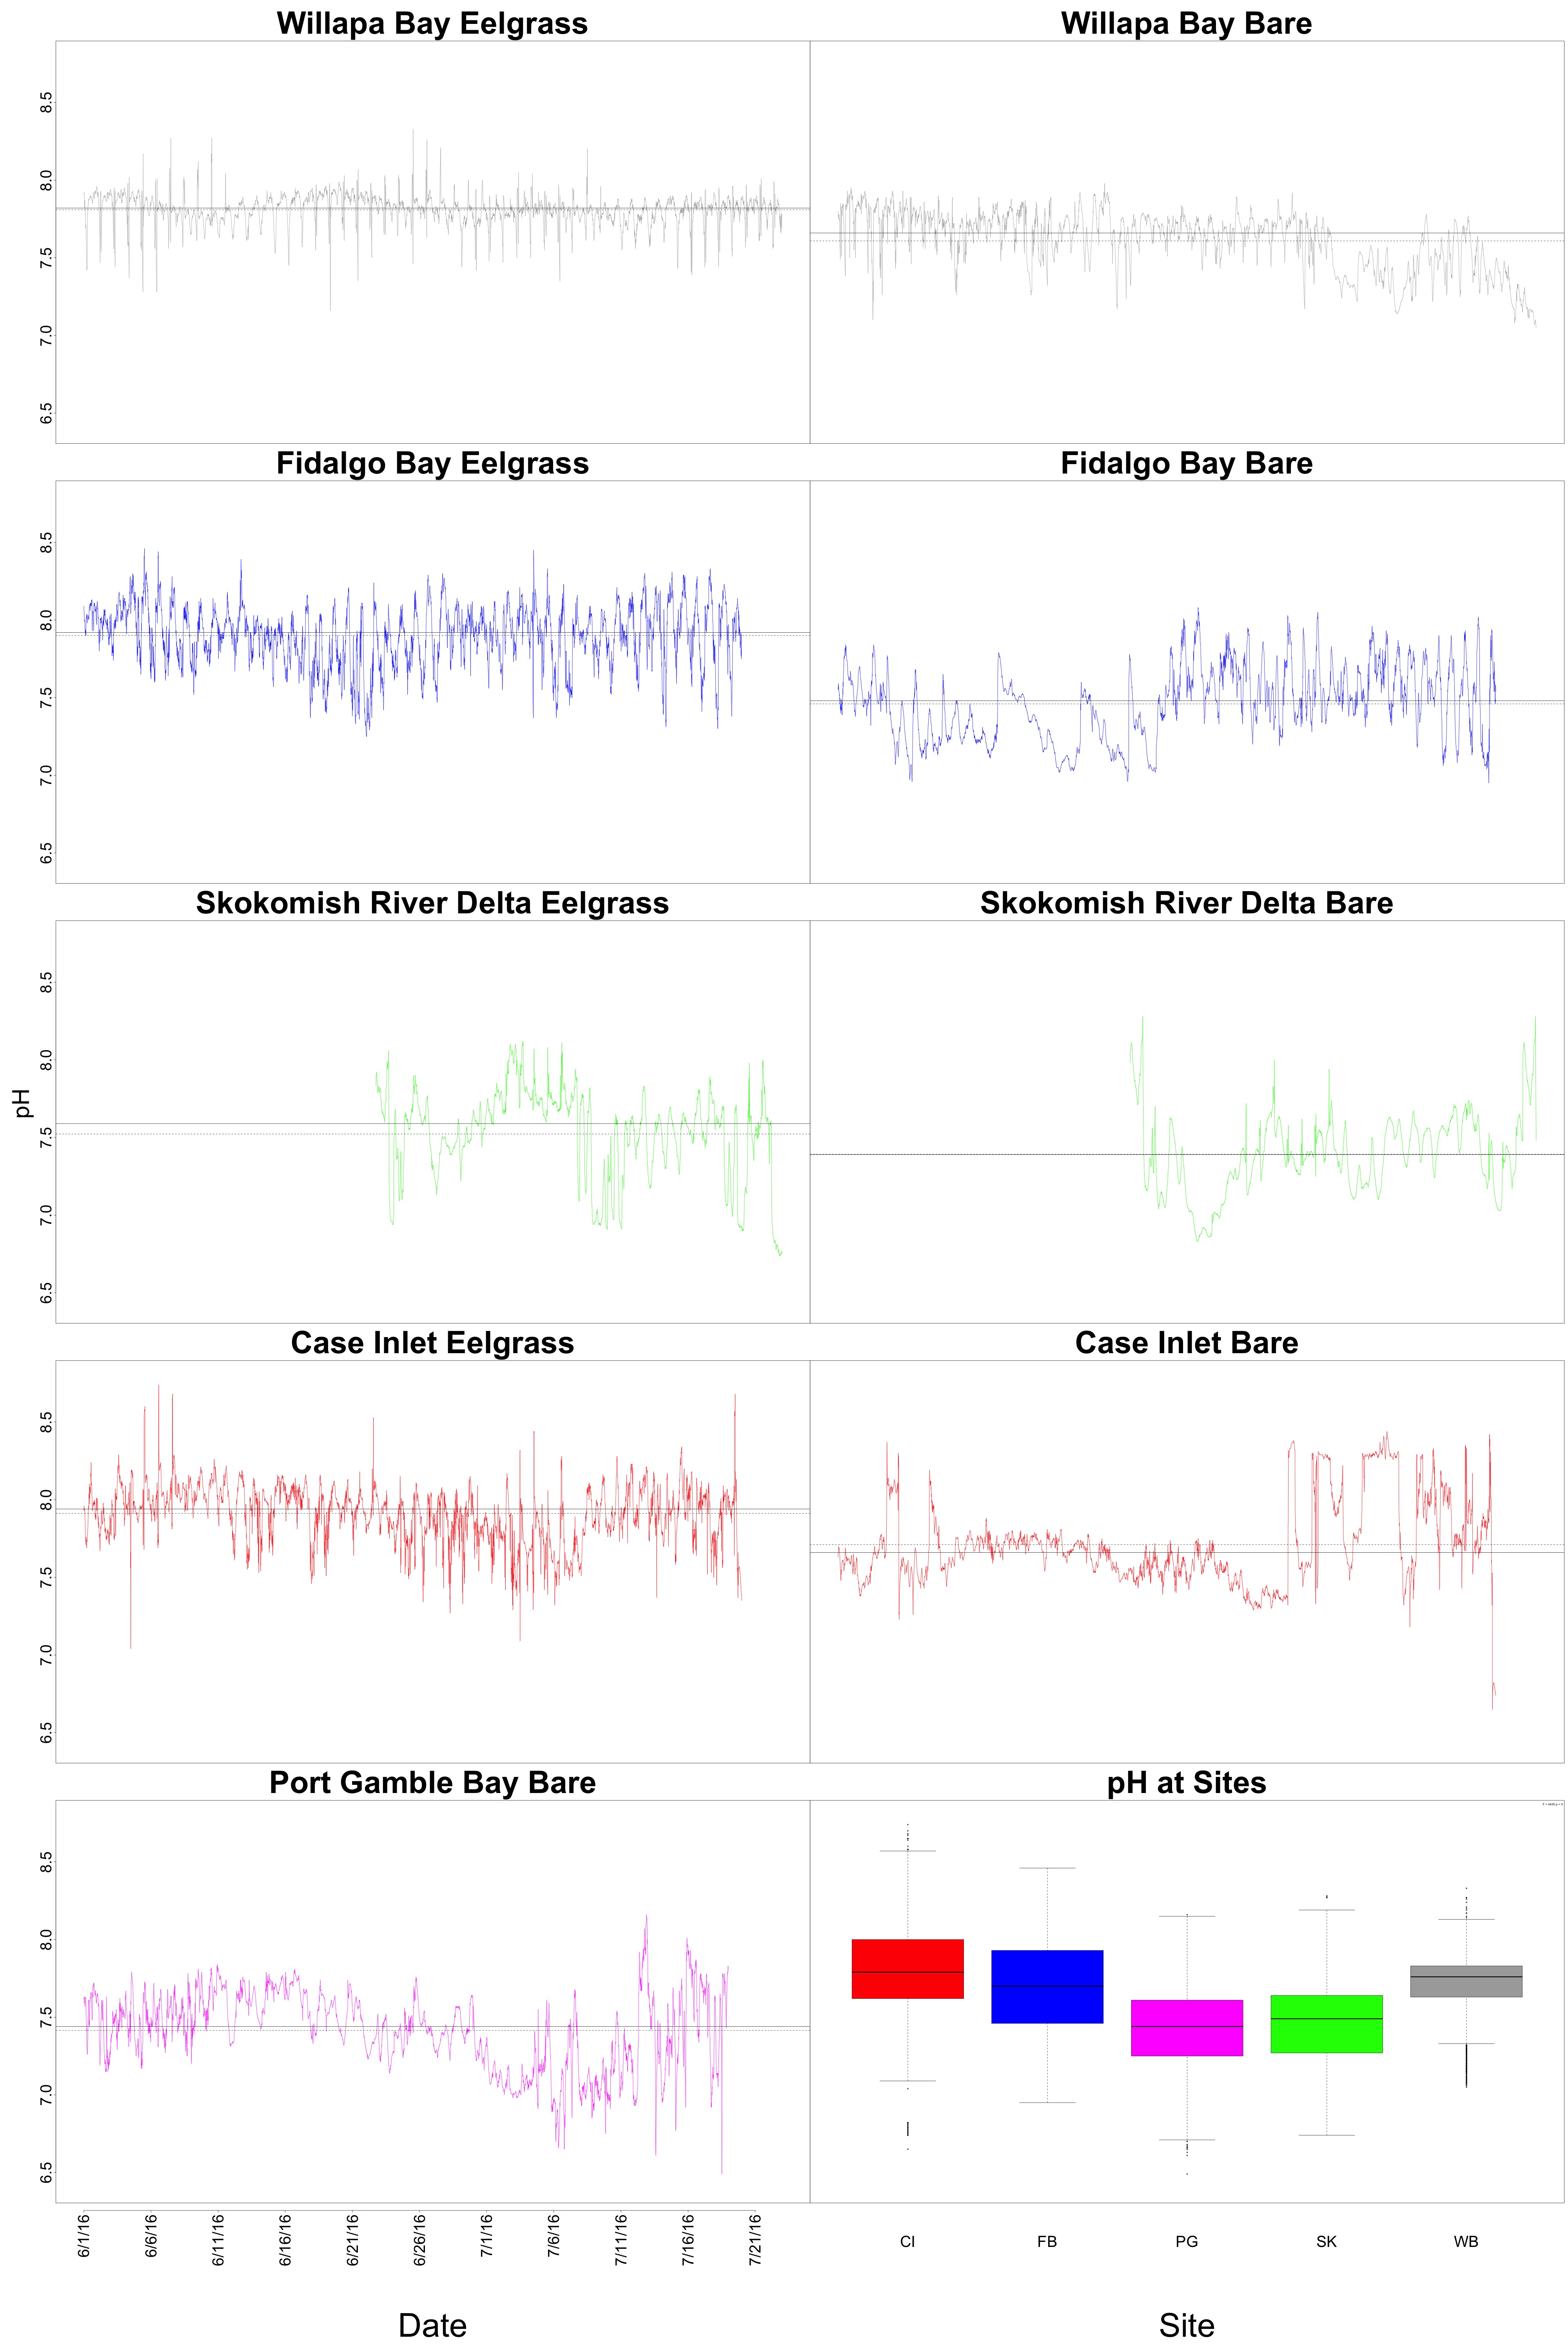
Figure 5. Diurnal fluctuation of pH at each site.
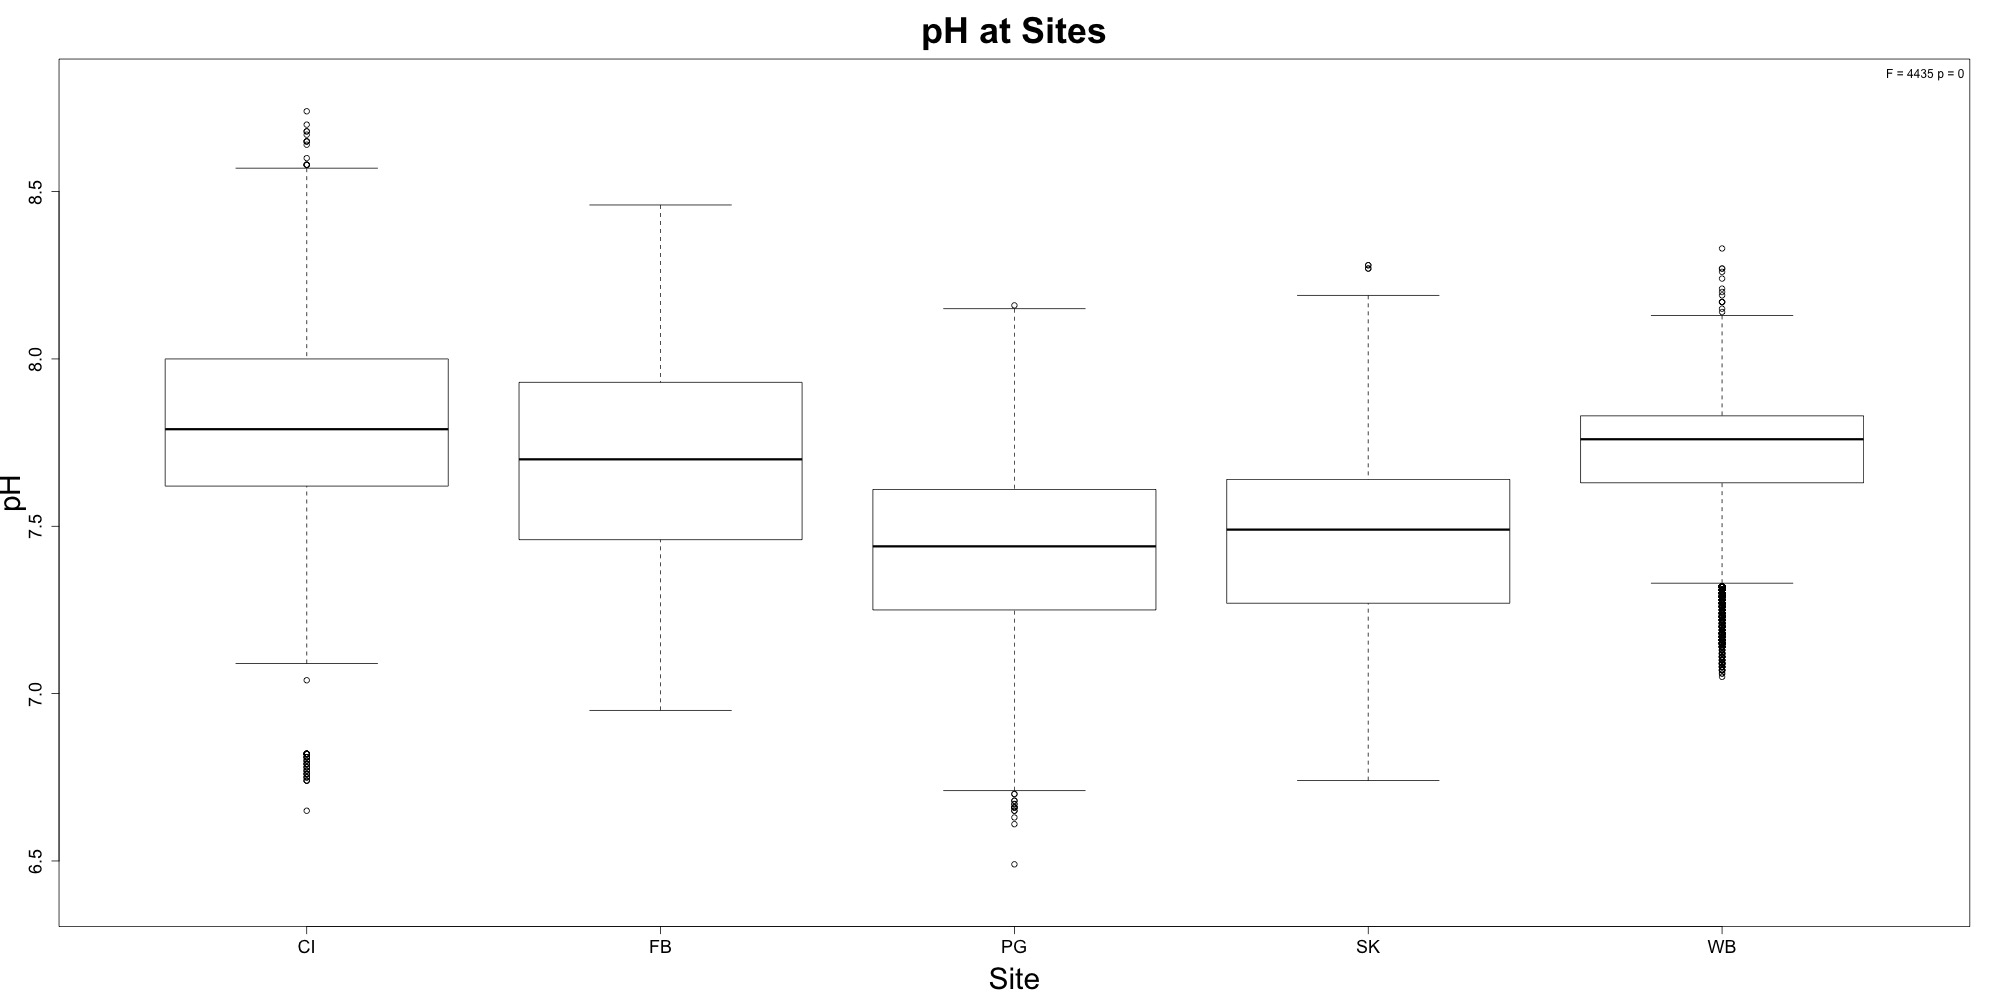
Figure 6. Differences in pH at each site.
Dissolved Oxygen
Willapa Bay had slightly lower dissolved oxygen than the other sites. However, this could be skewed by the fact that there are some extreme exposure values!
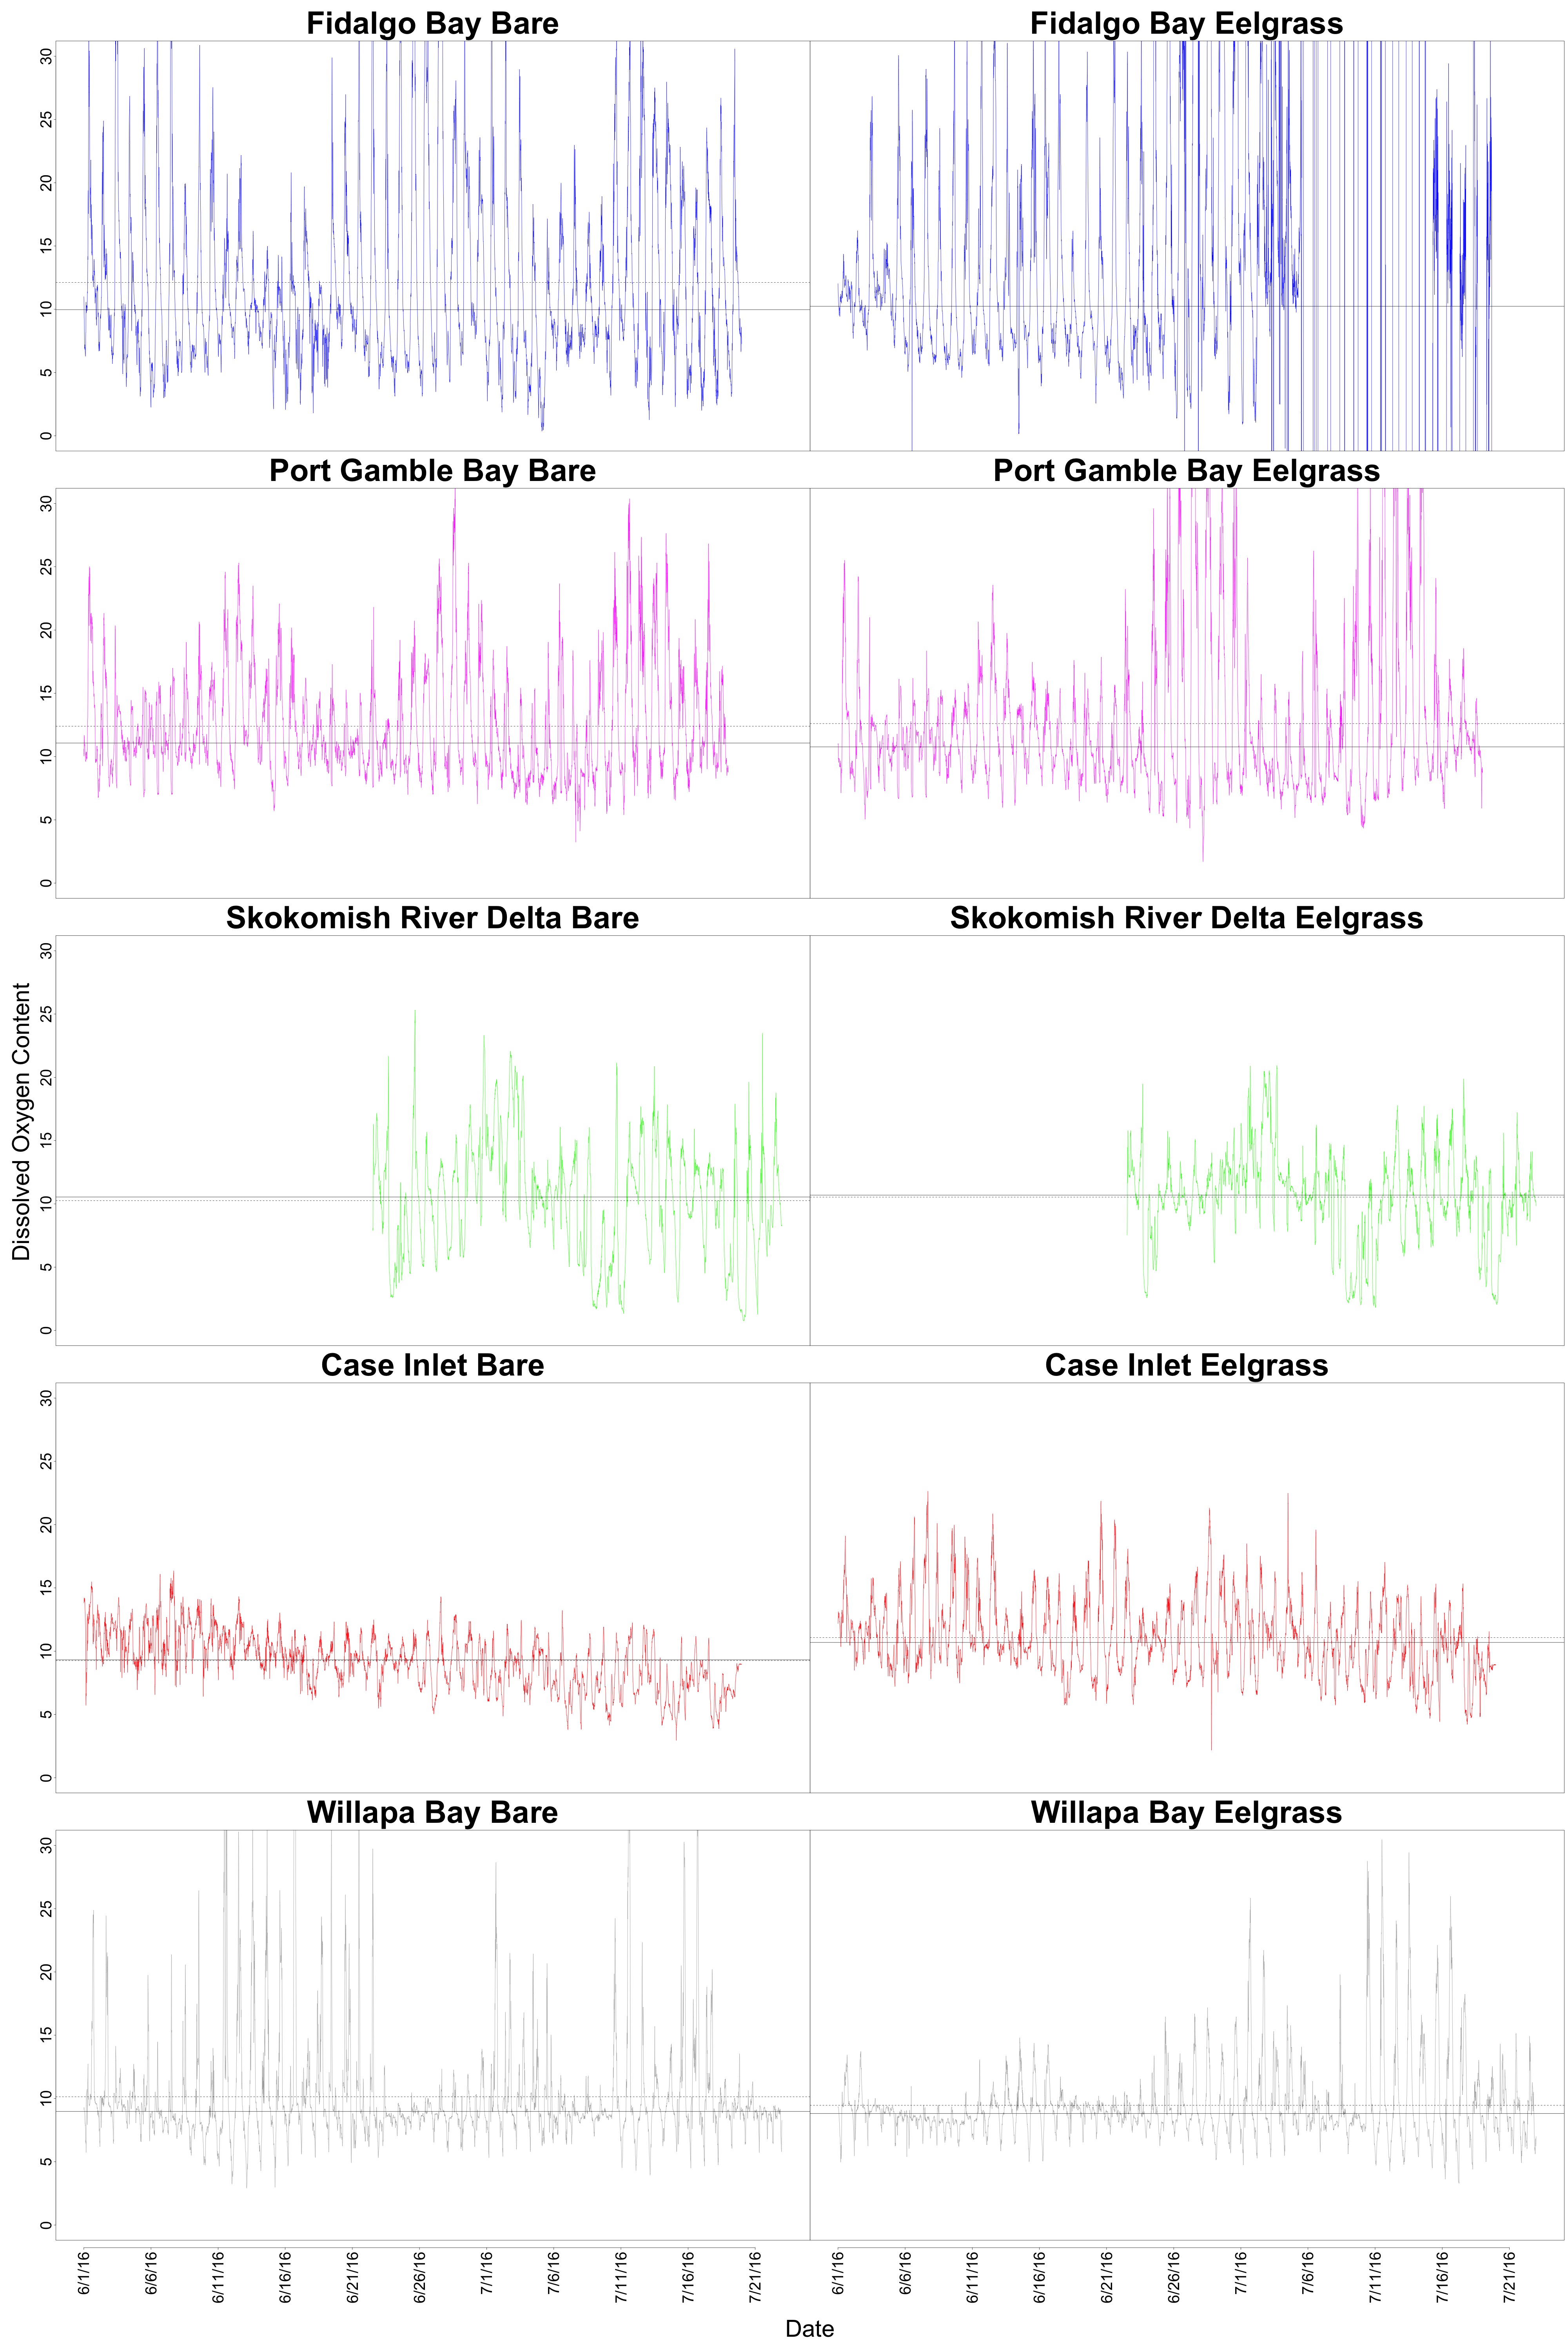
Figure 7. Diurnal fluctuation of temperature at each site.
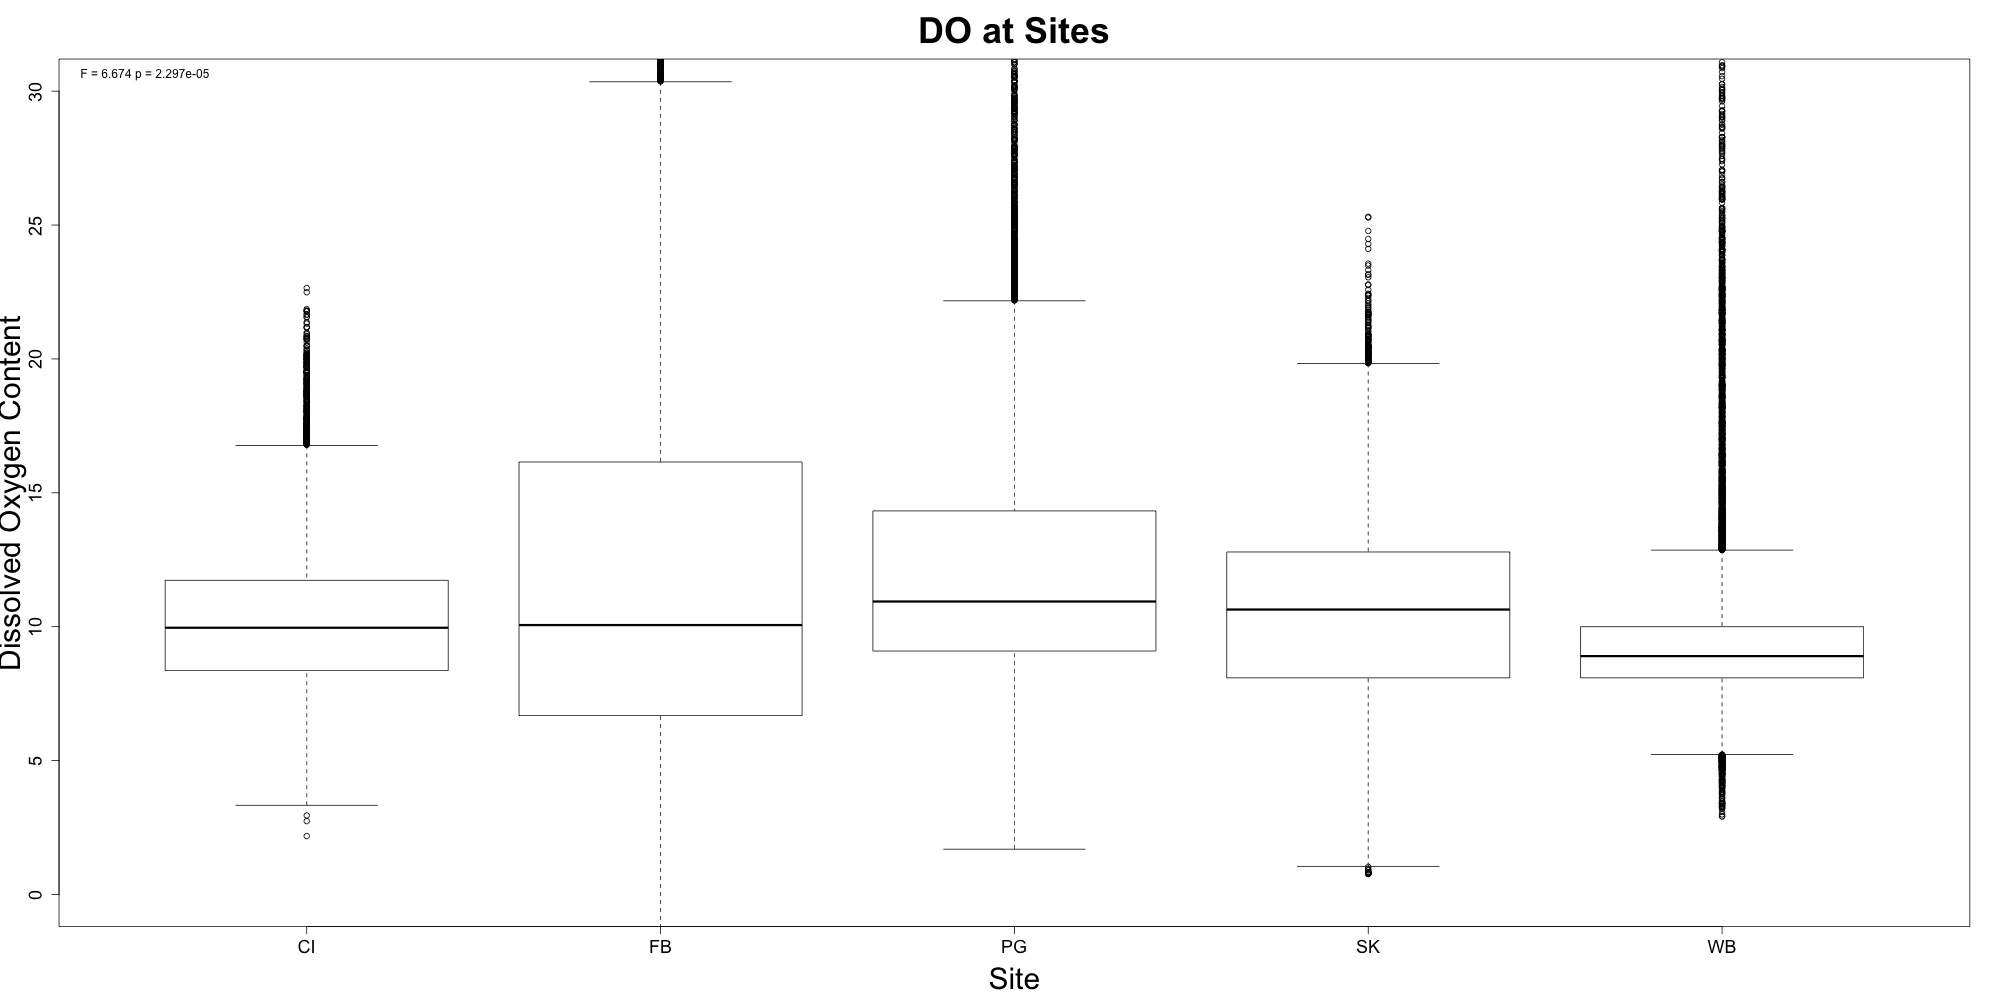
Figure 8. Differences in temperatures at each site.
Biomarkers
To see if any of Alex’s biomarkers explained peptide abundance variation, I regressed each biomarker against each peptide. My many, many scatterplots can be found here.
I skimmed through all of the R-squared values the regressions and didn’t see many that had values over 0.5. Perhaps there’s a different method I should try.