
Remaining Analyses Part 14
I see the light
I think I’m almost done analyzing data! Which means I’m close to just sitting, entering my mental happy place, and writing away (yeah, I guess I’m one of those scientists that like to write) :relieved:
Here’s what took me 4.5 days to feel motivated and 1.5 days to do:
Downloaded tide data
I downloaded tide data from the links in this lab notebook entry. I used Union as my Skokomish River Delta Site, just as Micah suggested. The website allowed me to get tide data in 10 minute intervals, which perfectly aligns with the environmental data I have. I formatted and saved the tide data in this .csv file.
Removed exposure times from data
Based my meeting notes, we decided to use a one-foot clipping. This means that I could not use any pH, salinity, or dissolved oxygen data when the tide was less than one foot. Such a conservative measure would ensure that the probe readings we use will always come from one that is submerged in water. In this R Script, I replaced all probe readings from less than one-foot tides with “NA”. I then replaced any values greater than 1.5IQR + Third Quartile or less than First Quartile - 1.5IQR (i.e. outliers) with “NA”. Within R Studio, as.Date and the ability to find and replace within a highlighted selection were extremely useful.
I followed Steven’s suggestion to only use data from bare habitats, so I didn’t manipulate any data from eelgrass outplants. The only exception is that I needed to use data from the eelgrass habitat at Port Gamble Bay for salinity data. For some reason, there is no salinity data from the bare outplant at that site. Not sure how this will effect downstream analyses.
I saved the quality controlled pH, dissolved oxygen, and salinity in separate .csv files.
Remade boxplots and timeseries figures
New data means new figures, right? I used the quality controlled data for pH, dissolved oxygen and salinity. I considered removing outliers for the temperature data, but since the general consensus was to not mess with that data, I didn’t bother. If I need to, I have the code!
Temperature
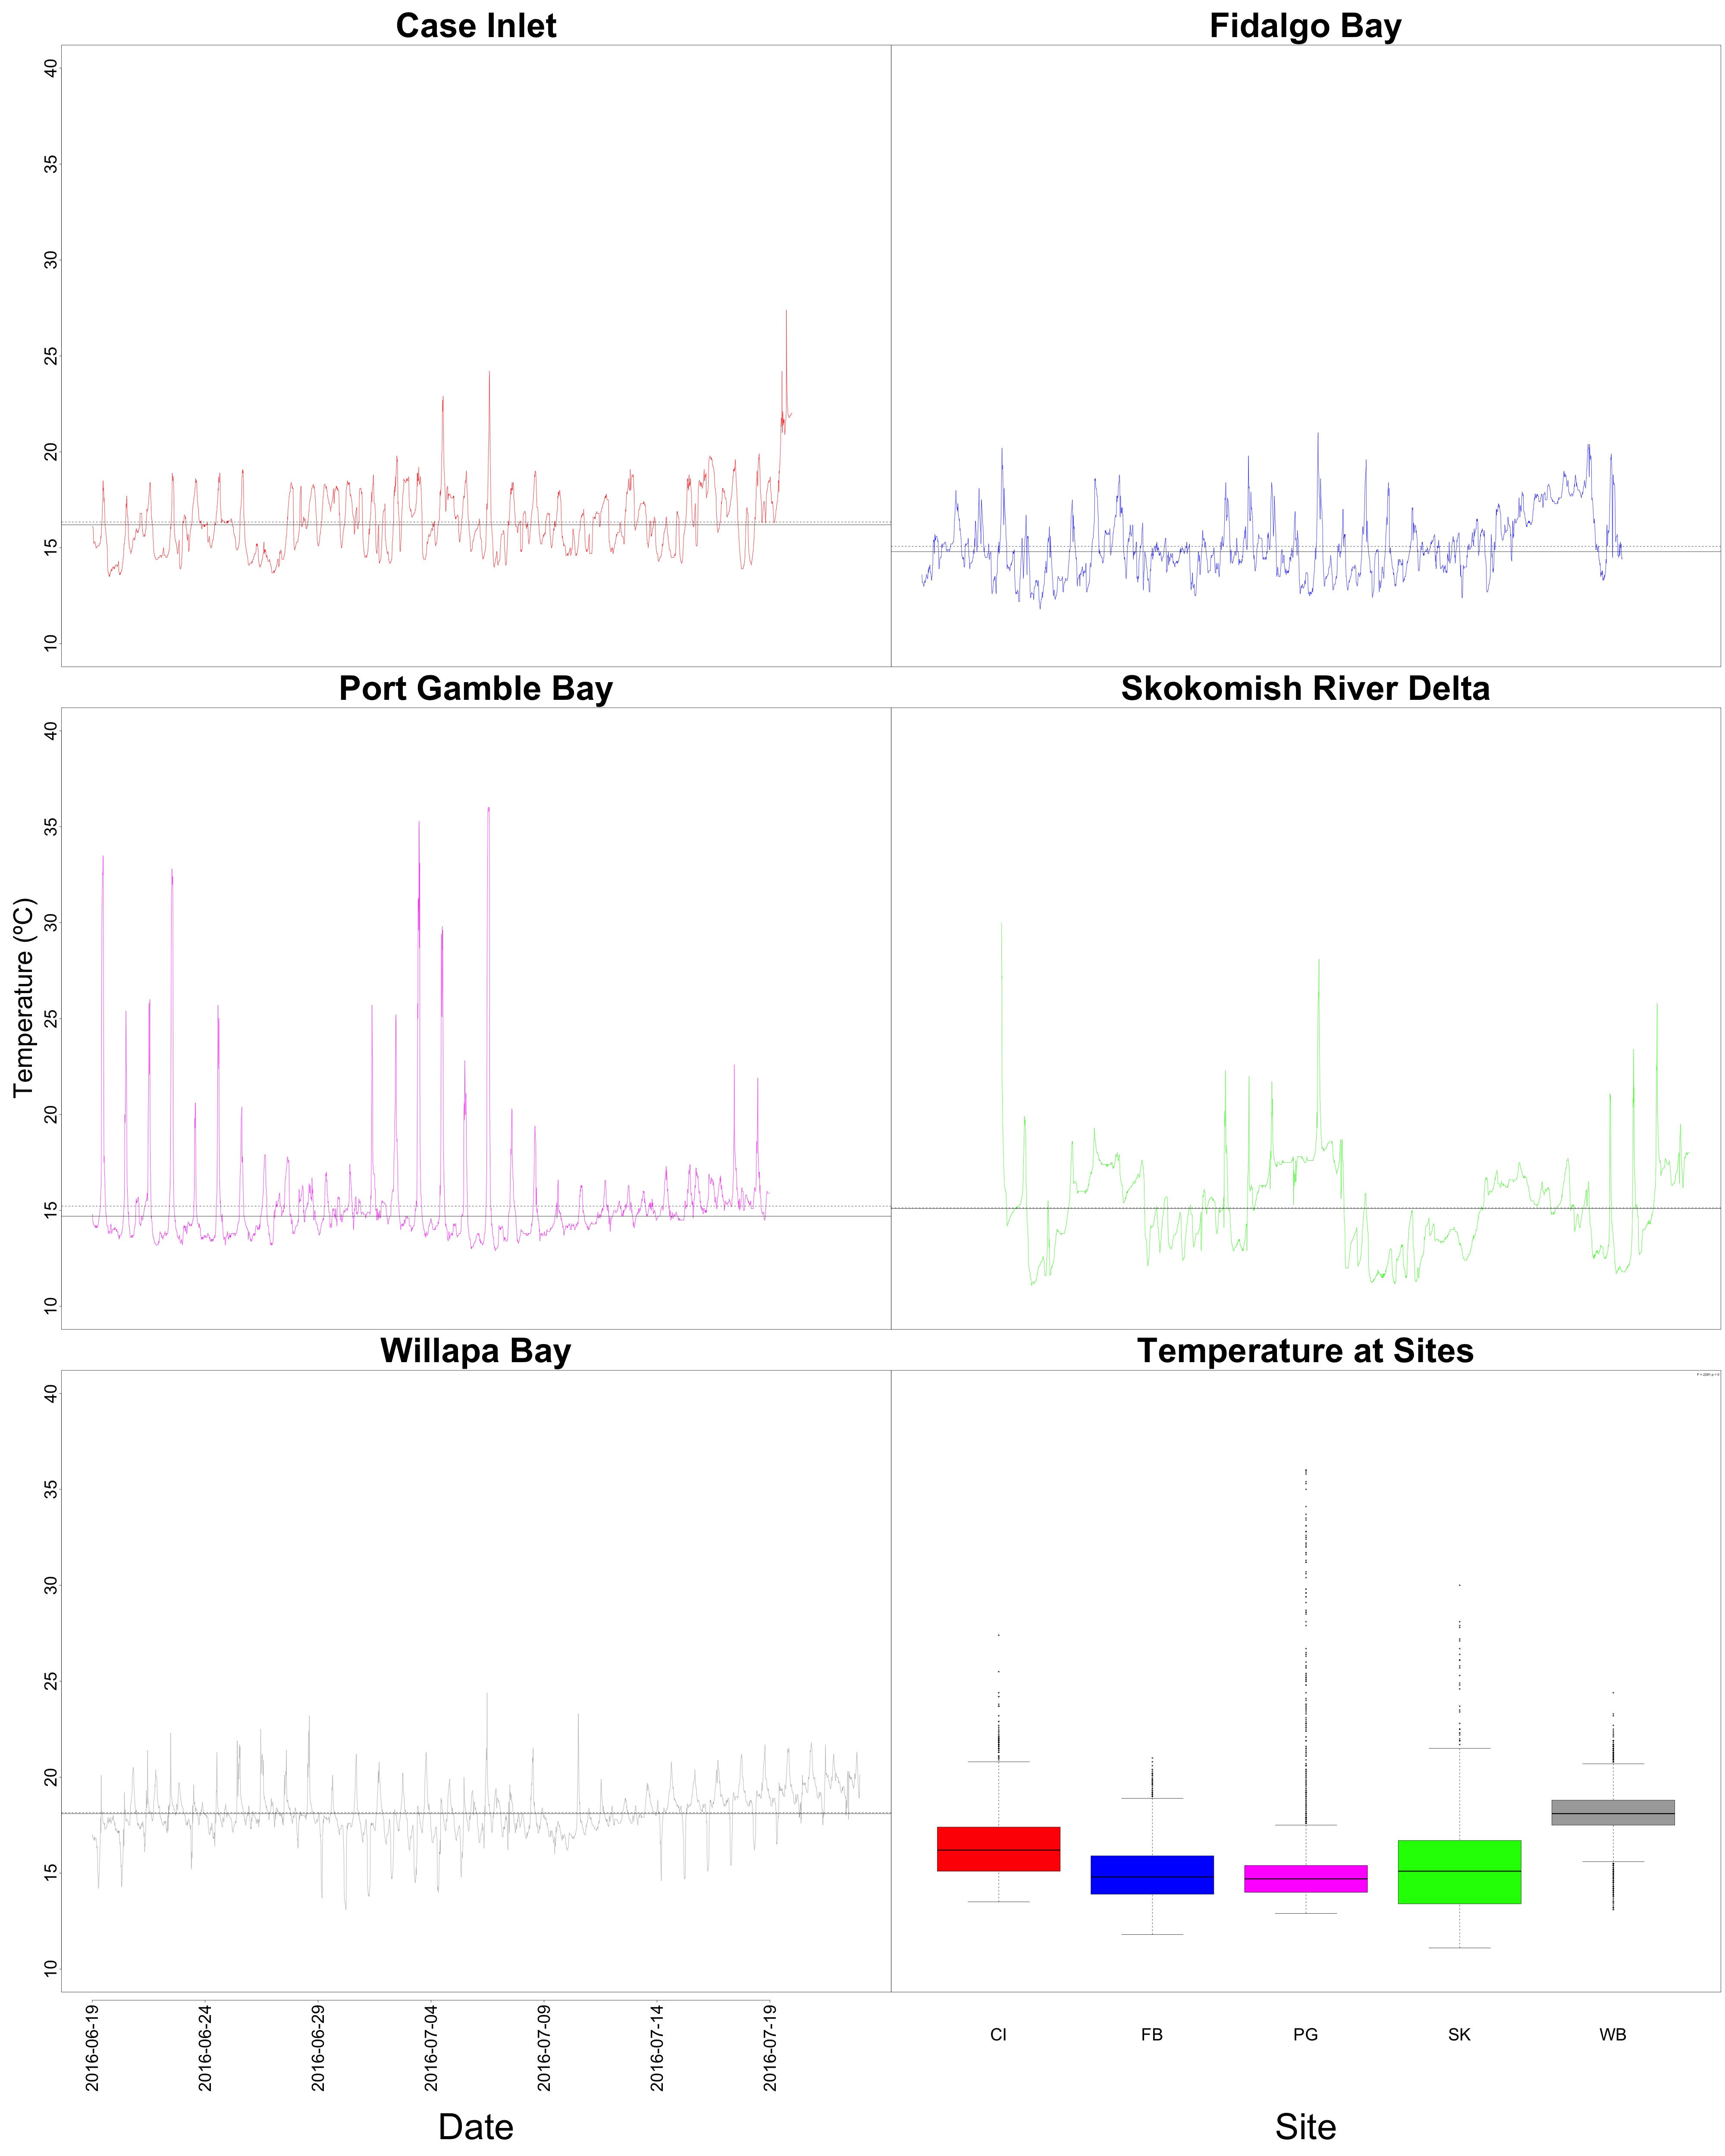
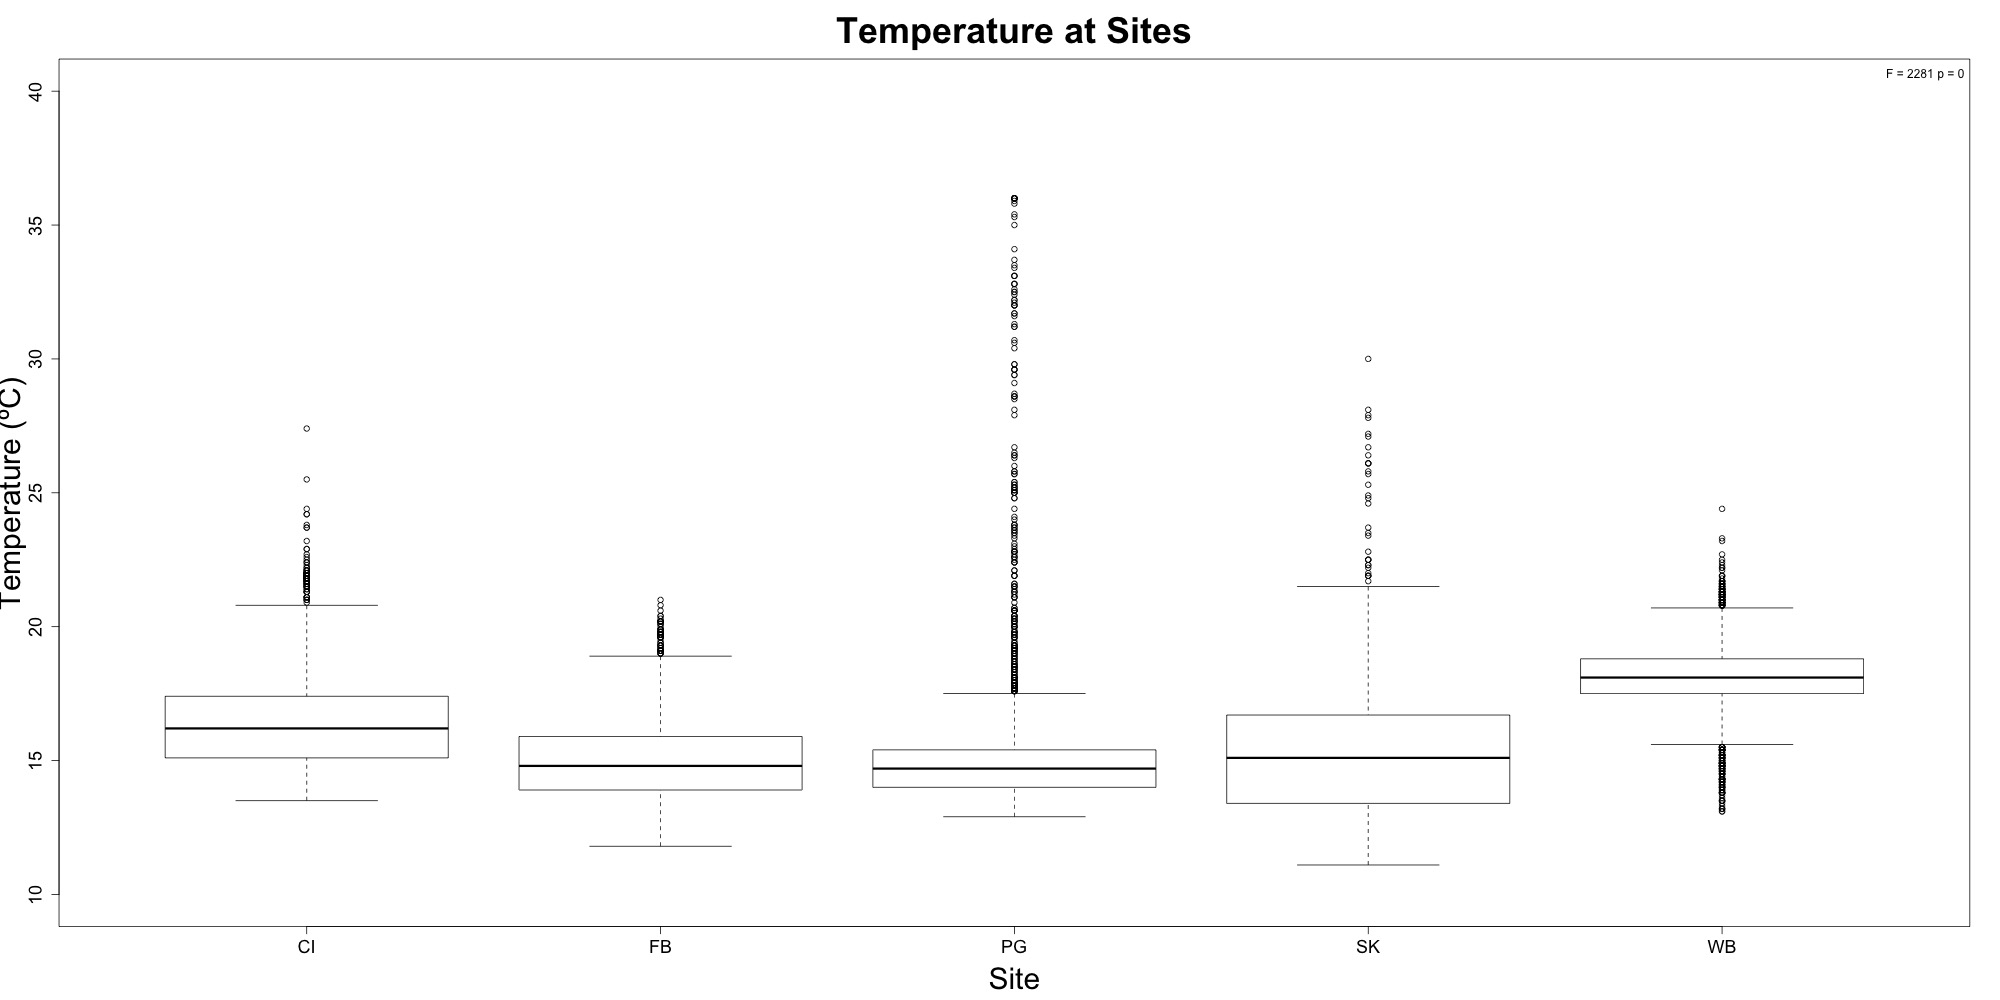
Figures 1-2. Temperature time series and boxplot comparing temperature between sites.
Nothing different to see here! Temperature at Willapa Bay was higher on average when compared to Puget Sound sites.
pH
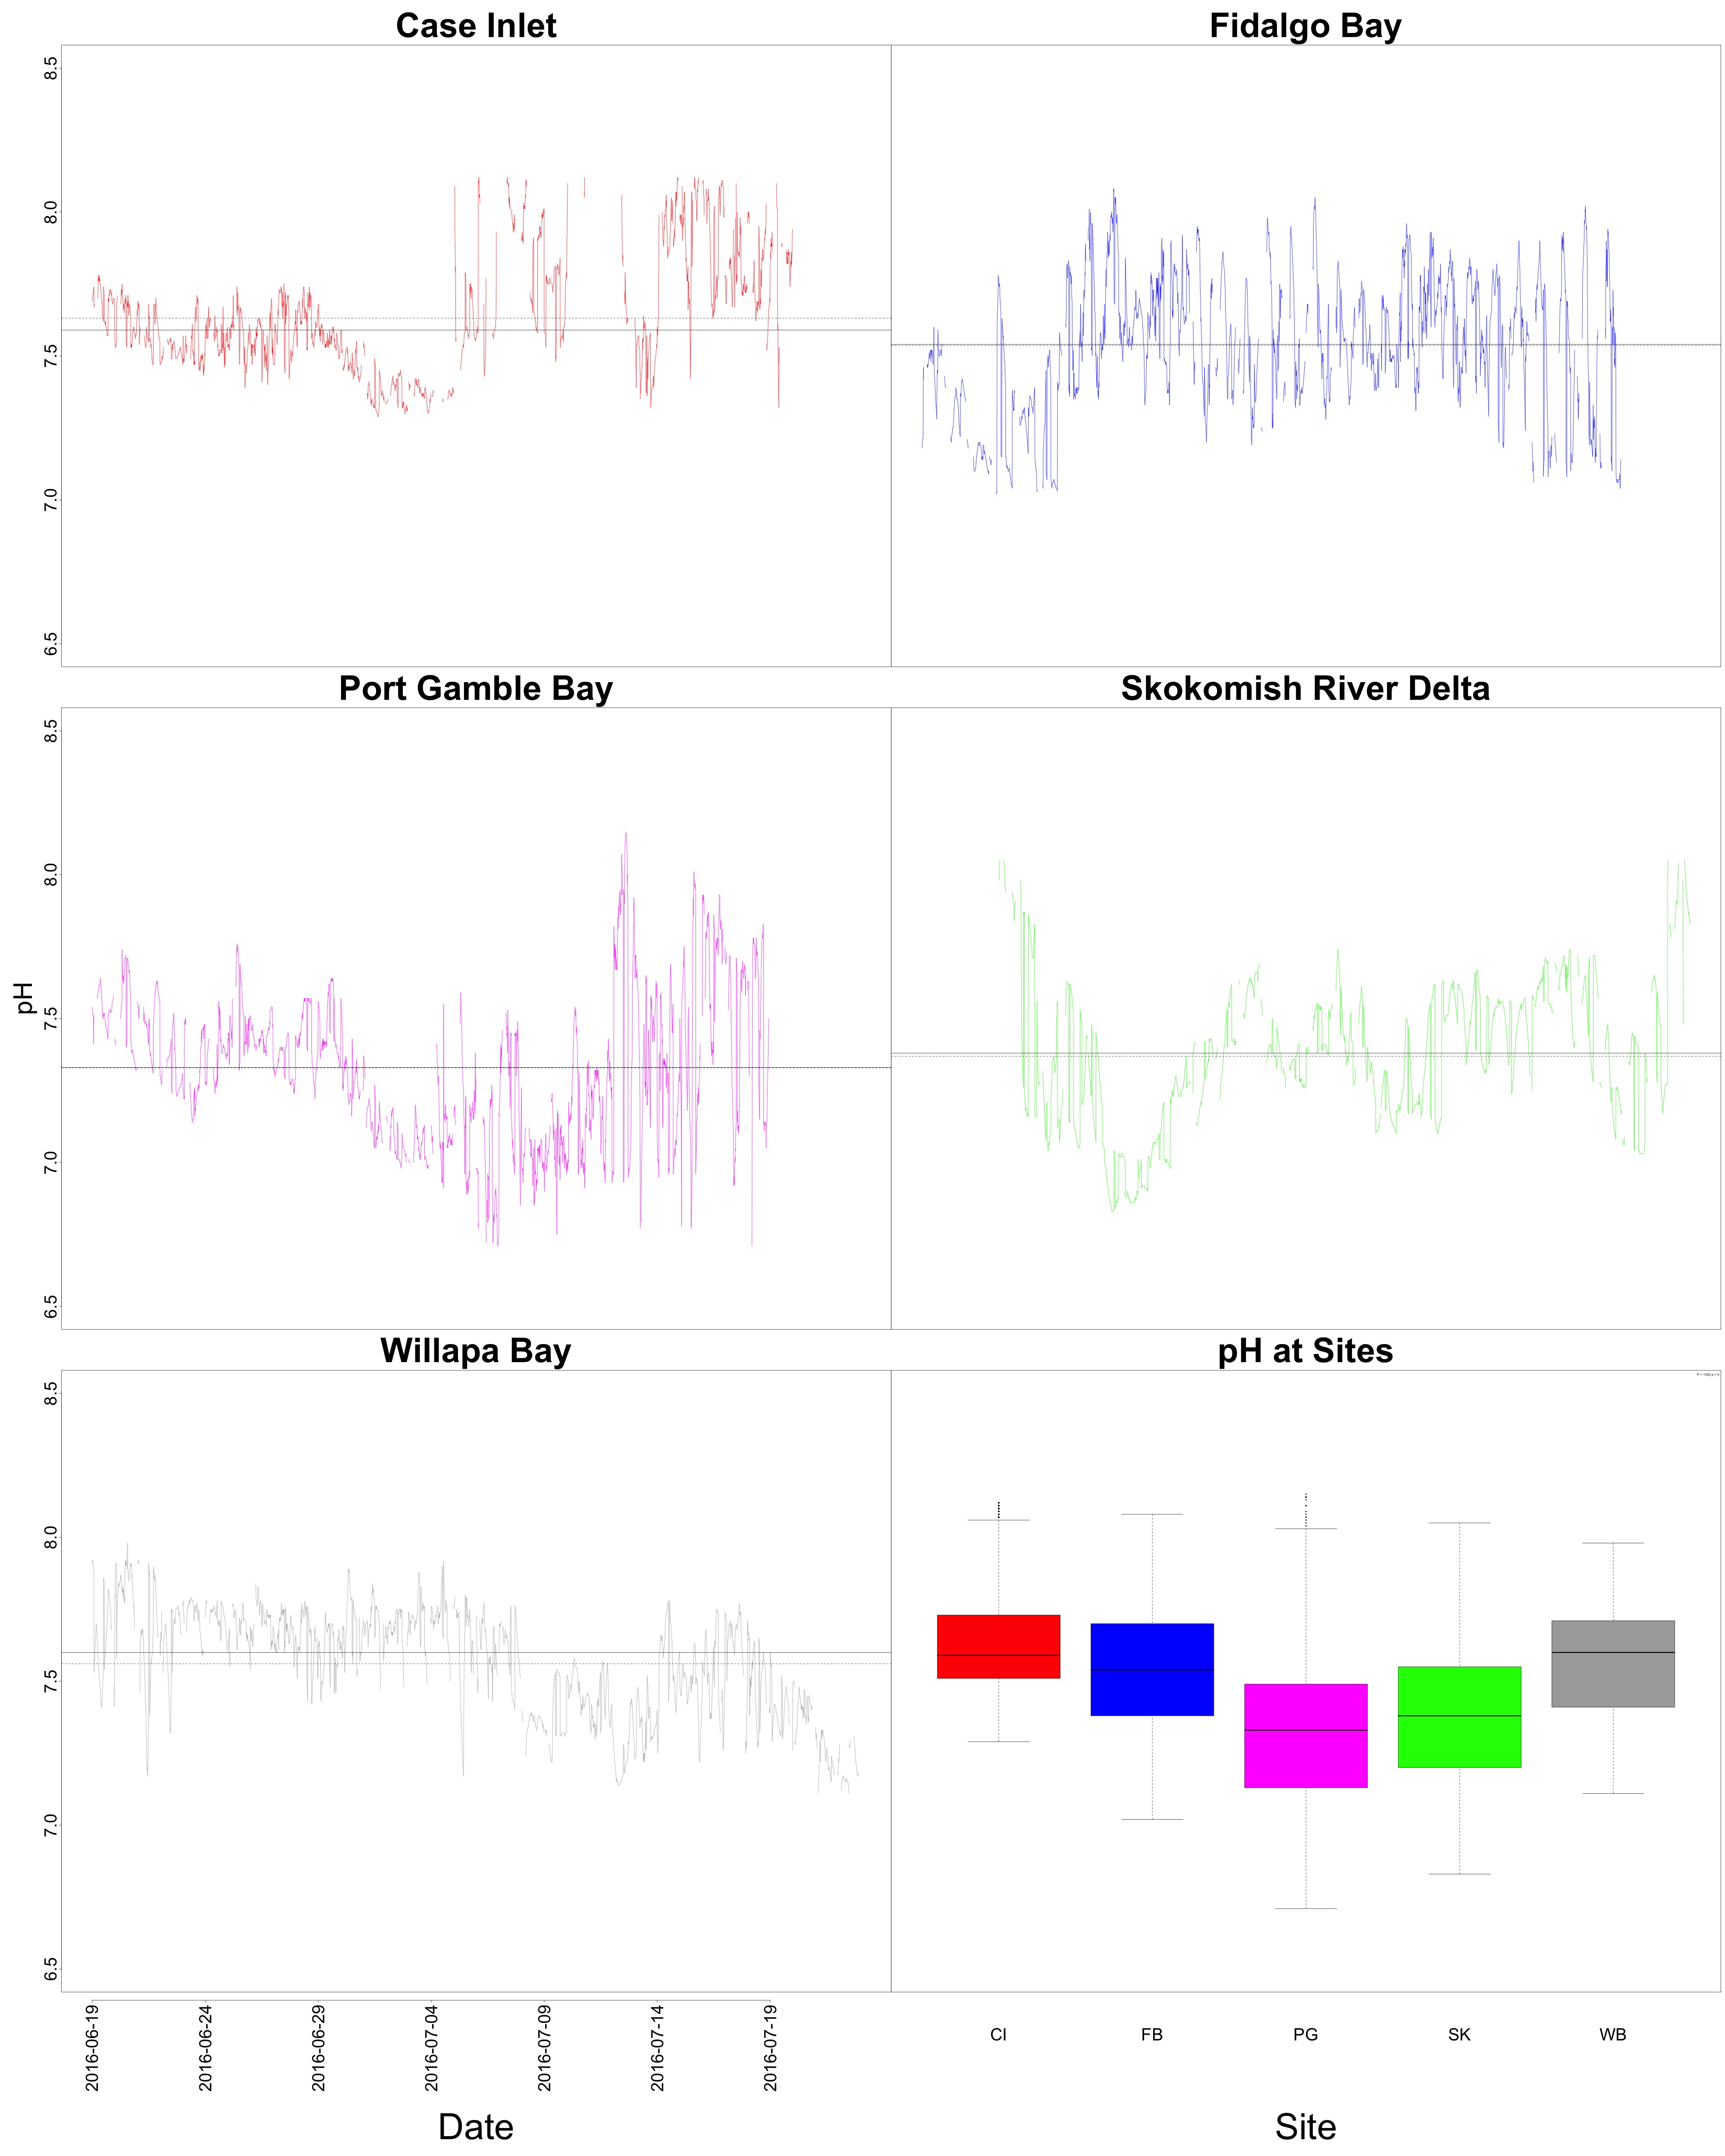
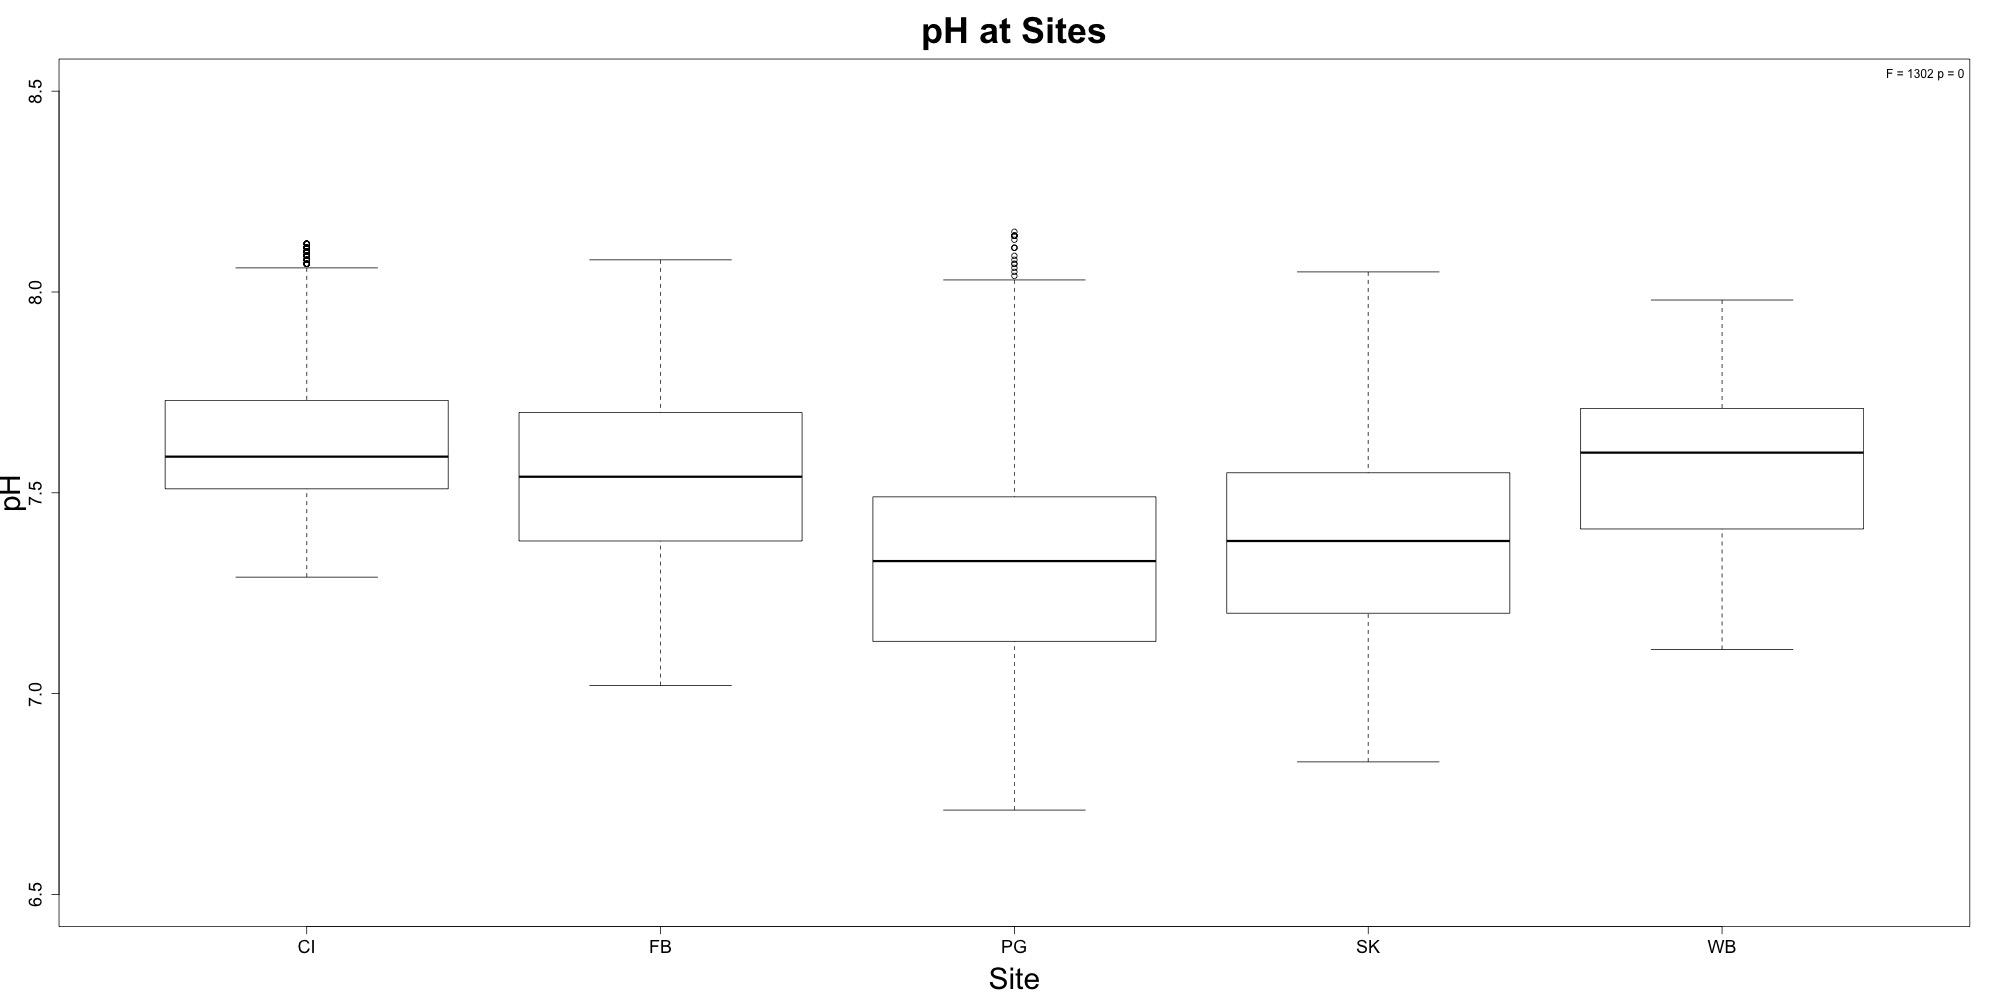
Figures 3-4. pH time series and boxplot comparing pH between sites.
Willapa Bay had the highest average pH, followed closely by Case Inlet. This is something I didn’t see before! The time series figure still shows wonky pH patterns towards the end of the outplant, possibly due to probe burial.
Dissolved Oyxgen
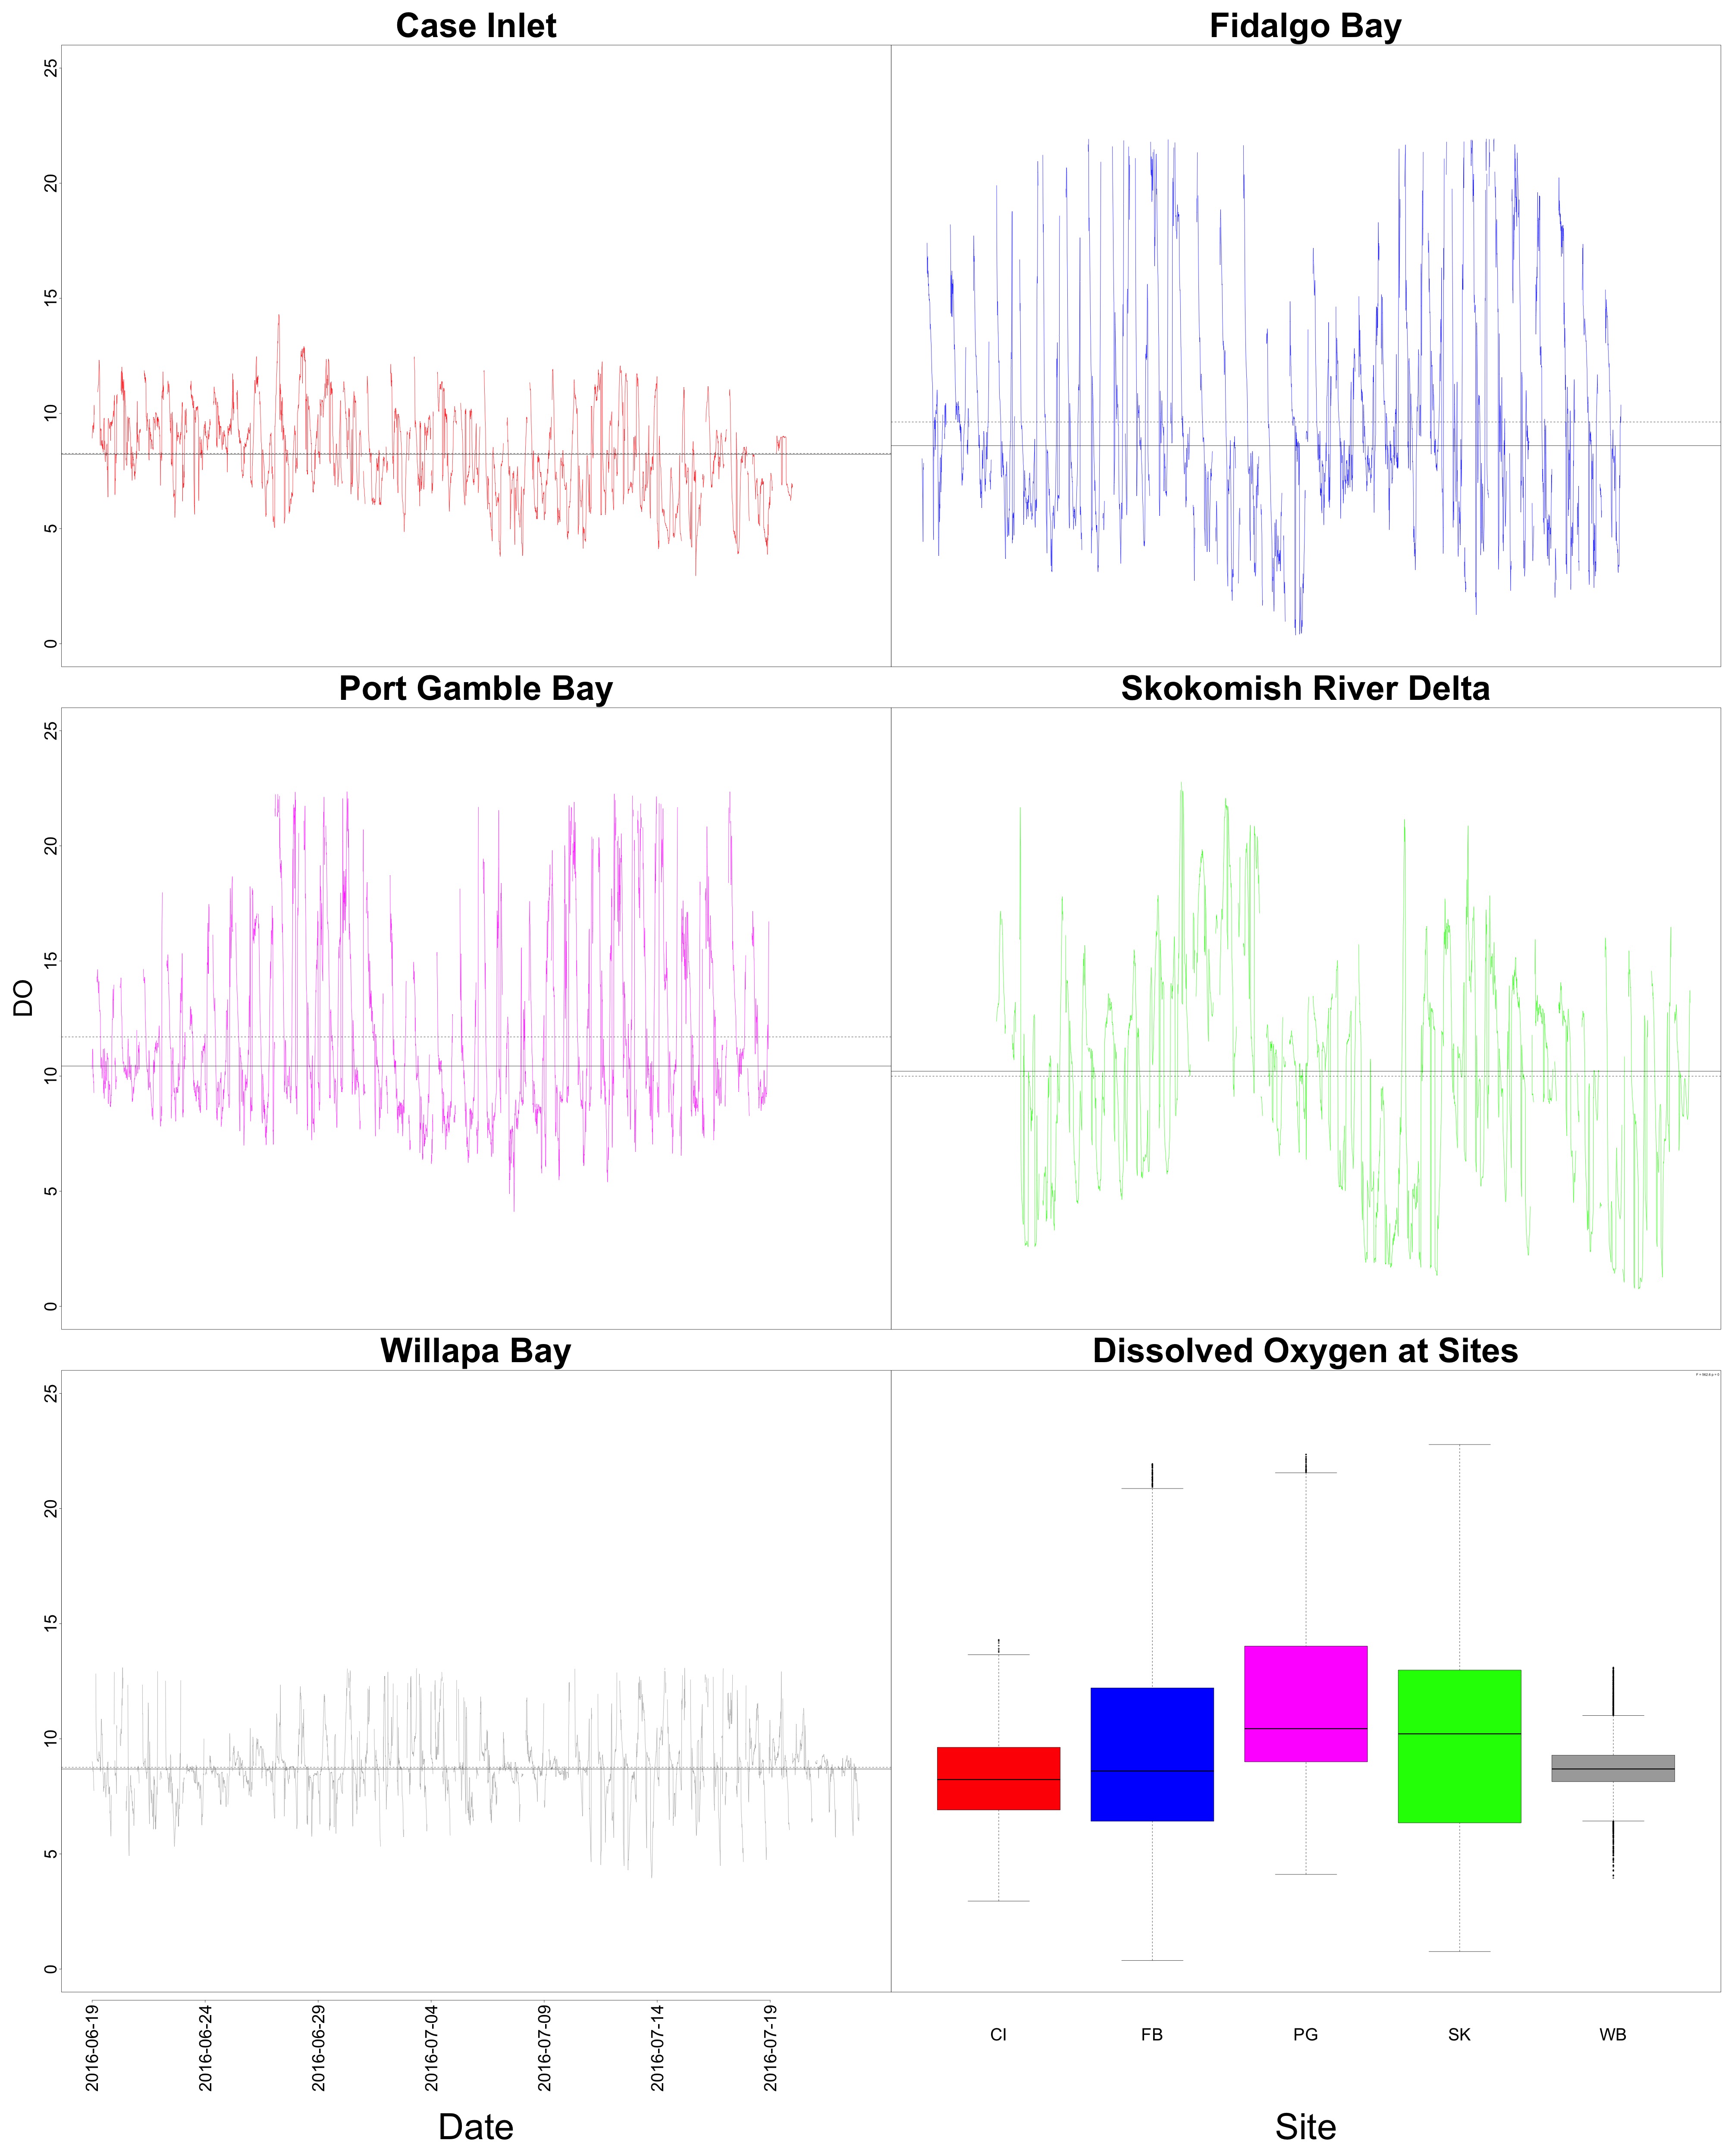
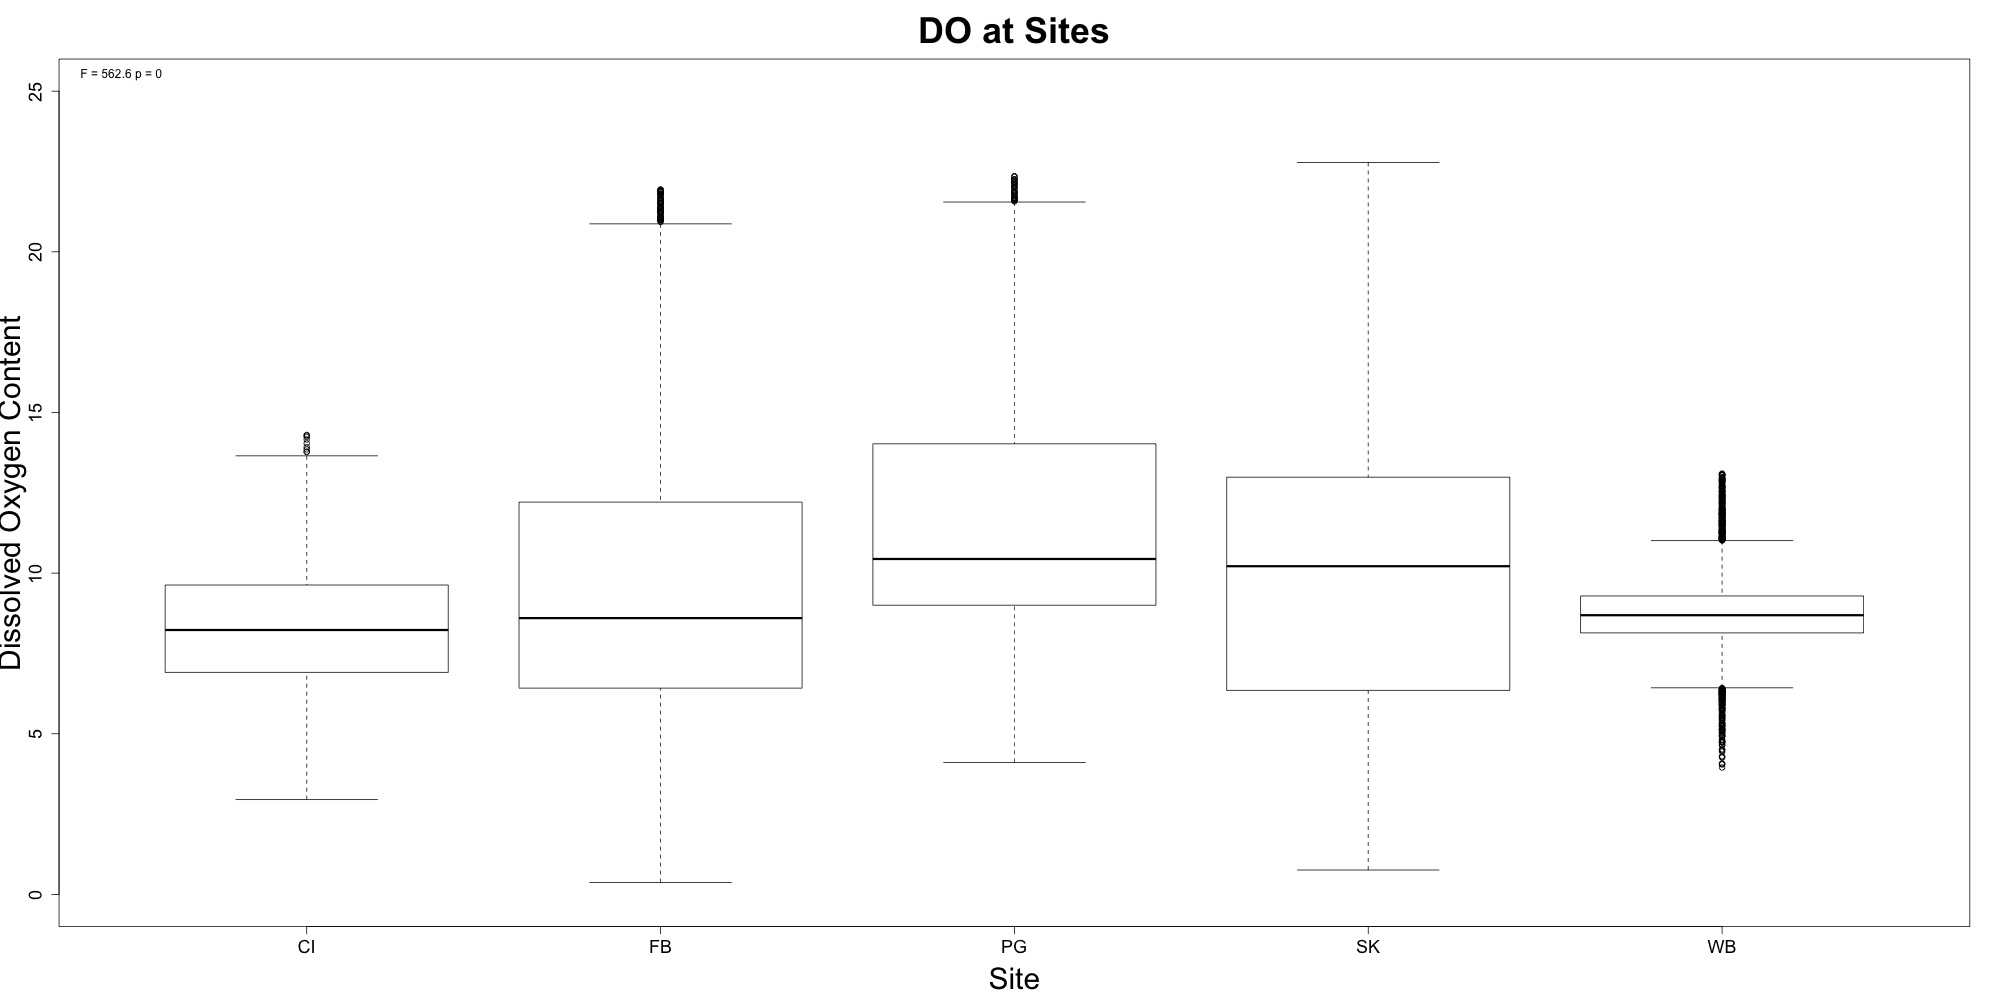
Figures 5-6. Dissolved oxygen time series and boxplot comparing dissolved oxygen between sites.
Willapa Bay had the lowest average dissolved oxygen content. Additionally, it had the least variability.
Salinity
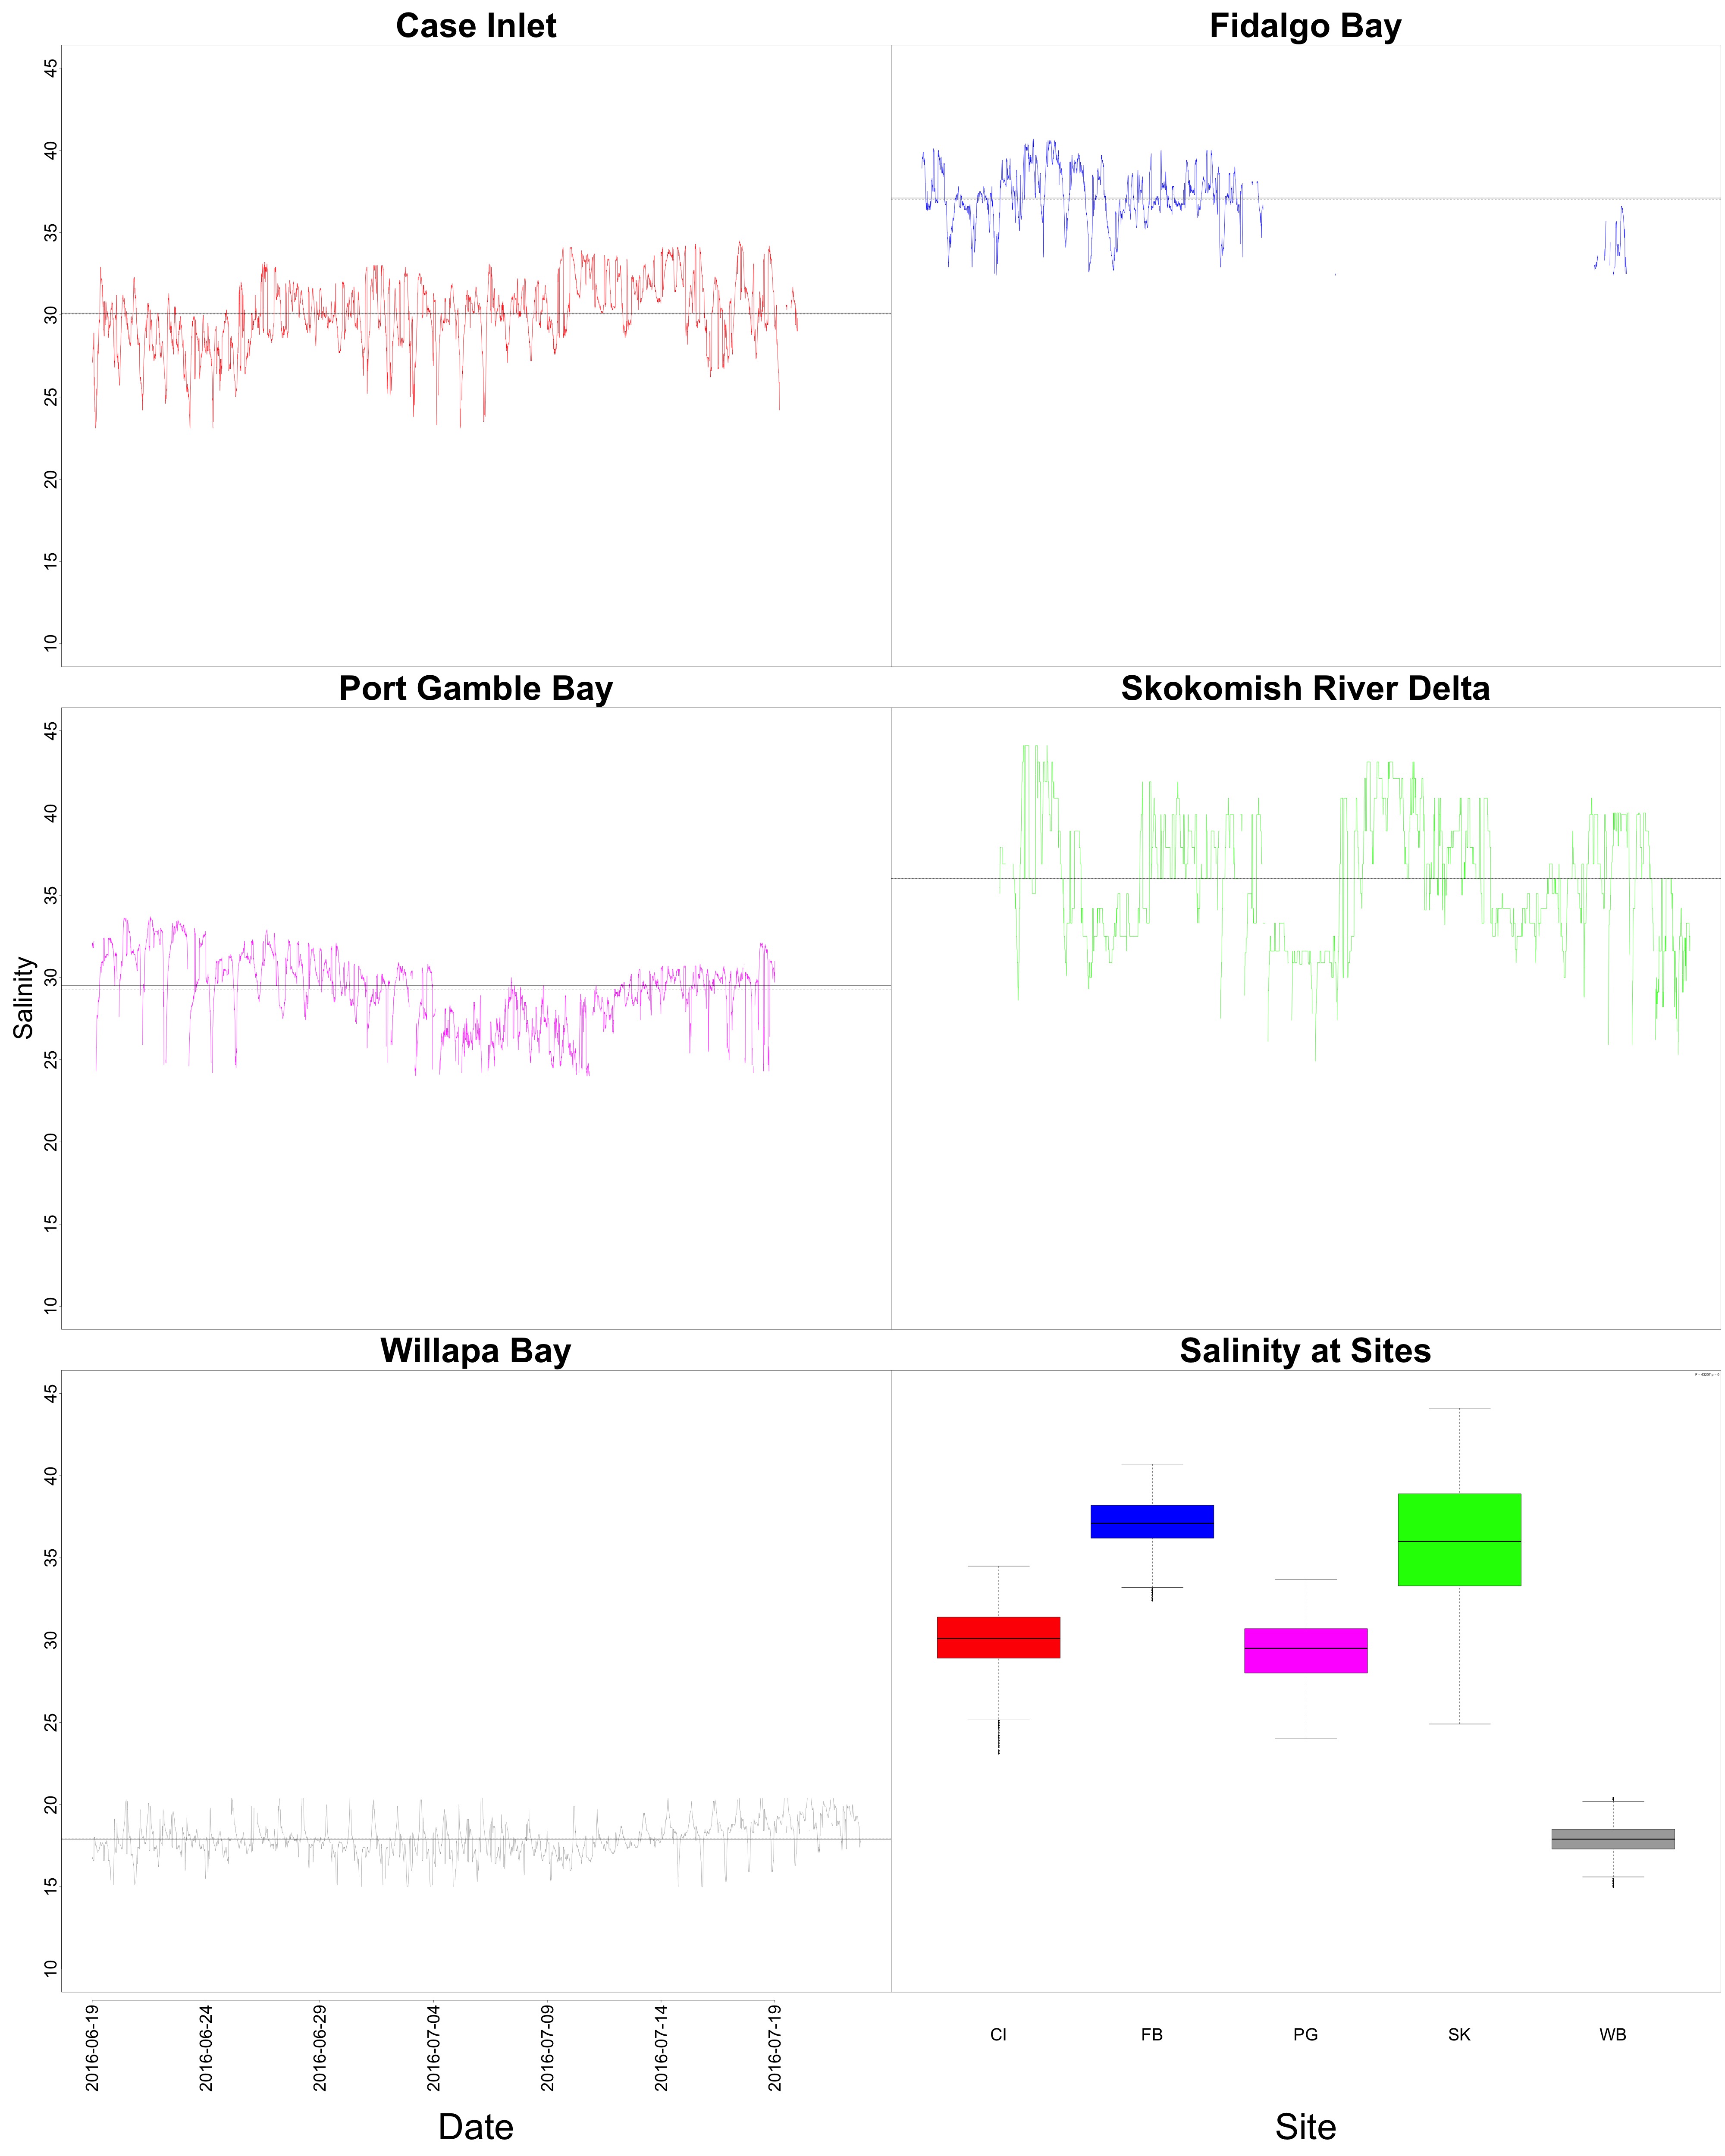
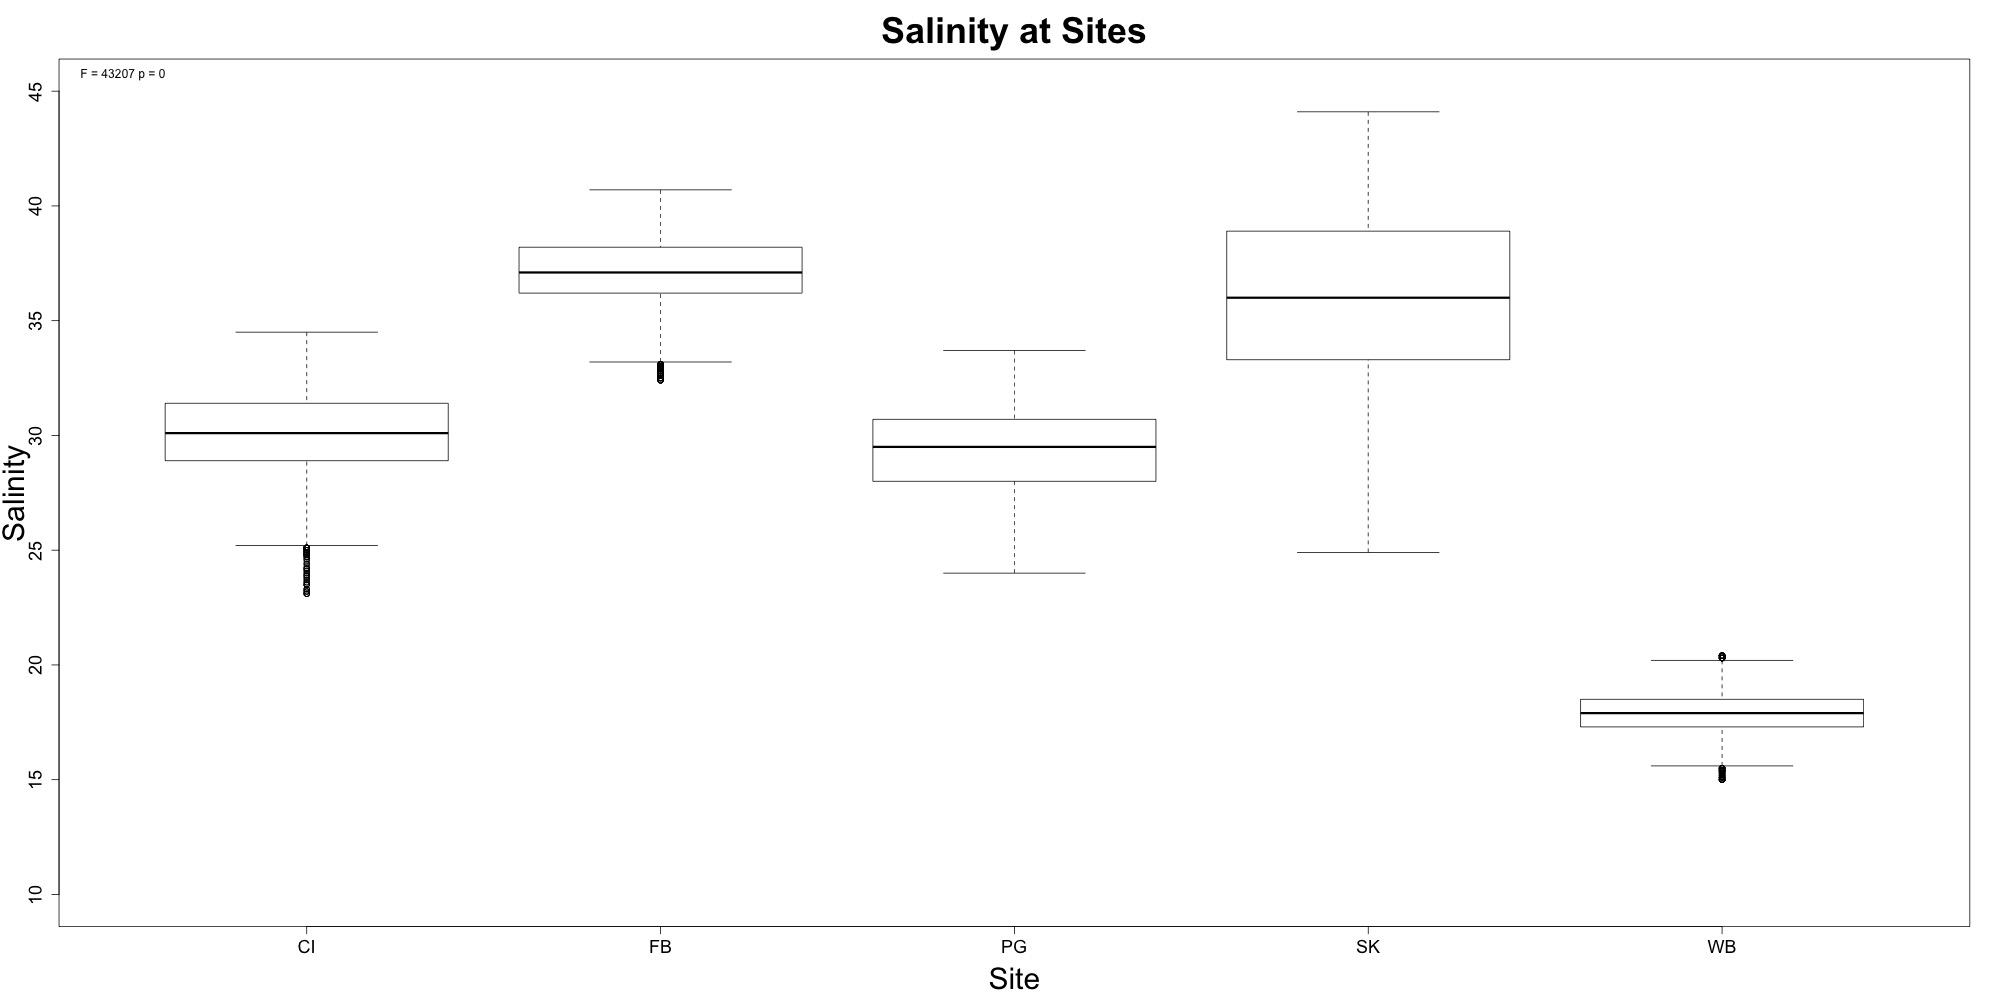
Figures 7-8. Salinity time series and boxplot comparing salinity between sites.
Woah, Willapa Bay very clearly had the lowest salinity levels! There also seems to be some sort of geographical gradient with salinity that could be helpful for Laura’s work. The timeseries plot shows that we needed to remove a lot of the data from Fidalgo Bay due to the probe malfunctioning.
Variable of interest tables
I’ve learned that Steven likes tables, so I made some. I calculated at 12 different variables of interest at each site for each environmental variable in this R script. These are the variables I looked at:
- Maximum
- Minimum
- Range
- Mean
- Variance
- Standard Deviation
- Percentage of data ± 2 SD
- First Quartile
- Median
- Third Quartile
- IQR
- Percentage of data > 1.5IQR * Third Quartile and < 1.5IQR * First Quartile
I wrote out a different .csv file for each environmental variable:
Now I have something to share at tomorrow’s lab meeting! I’m also going to analyze the growth data from Micah with the hopes of sharing those results.
Back to R!